If you’ve ever tried to explain a complicated idea to employees and coworkers using raw data, you may have seen that people don’t always remember it well. This is because plain data can be really boring to understand. Whether you’re trying to share an annual report or a new business plan, if you show your information in a long and text-heavy PDF, you might end up needing to repeat yourself.
This is why it has become so important to visualize your data. Humans have a shorter attention span than goldfish, and some people can barely focus on one data point for more than 8 seconds. You need to relay important metrics in a way that will be absorbed. The answer? Convert that data into an engaging and beautiful chart!
If the idea of visualizing lots of data is making you sweat, don’t worry. Here are 5 awesome chart makers that will not only blow your data out of the water, but will ensure that you do so with ease.
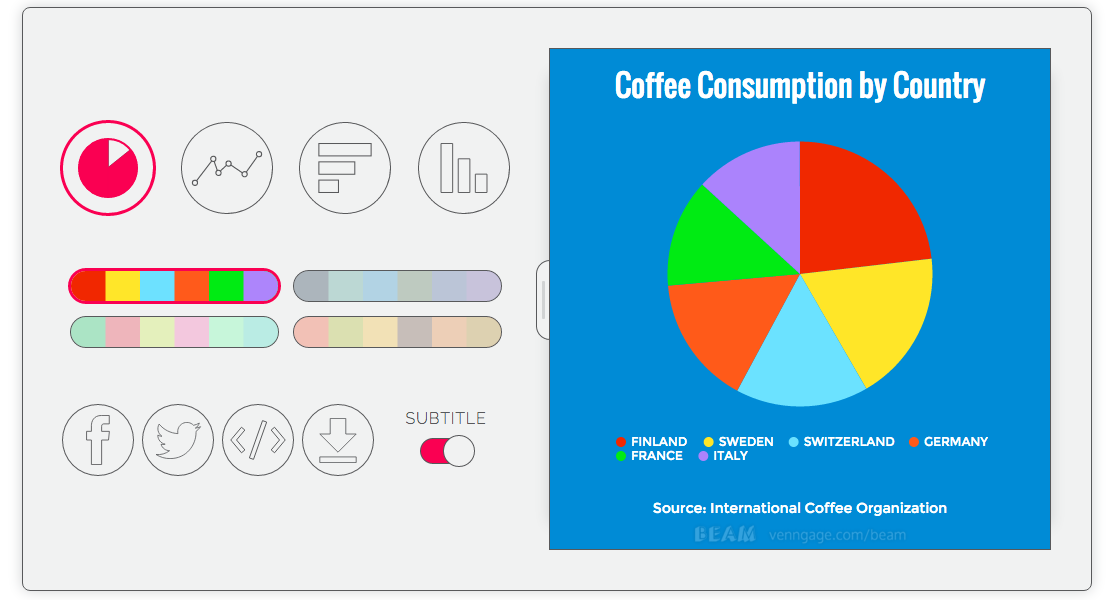
Beam is a brand new chart maker tool in the works that is currently accepting requests for early access. The tool allows you to generate a range of different chart types and styles at the click of a button. Simply import your data from an excel document, pick a color scheme, a chart type and you’re done. Better yet, the tool will be completely free to use without any sign-up required.
2) Venngage: Infographic Maker
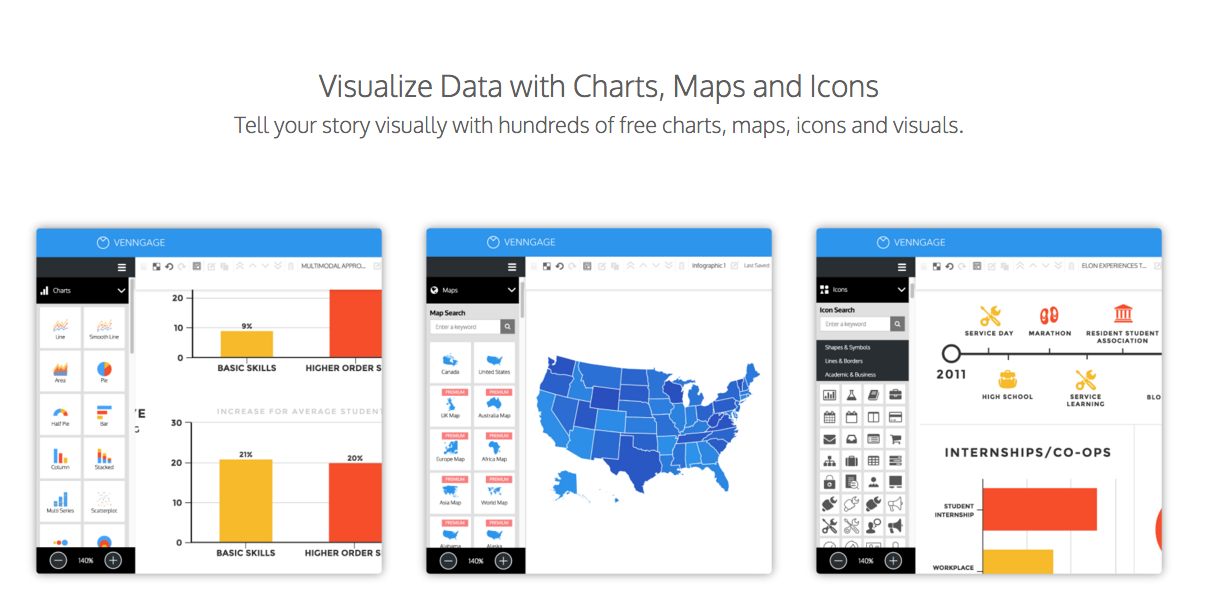
Venngage is another free tool that allows users to create a free account and select from various different chart types. Make anything from pie charts, bar charts, area charts, line charts, interactive maps and more by simply copying and pasting a link to your Google Spreadsheet. They also have over 10,000 icon choices for making pictograms. If you’re looking to create more complex visualizations and infographics, Venngage lets free users make up to five infographics at no cost, before having to upgrade. The blog provides plenty of insights and tips for how to make an infographic as well.
3) Datawrapper: Create Visualizations
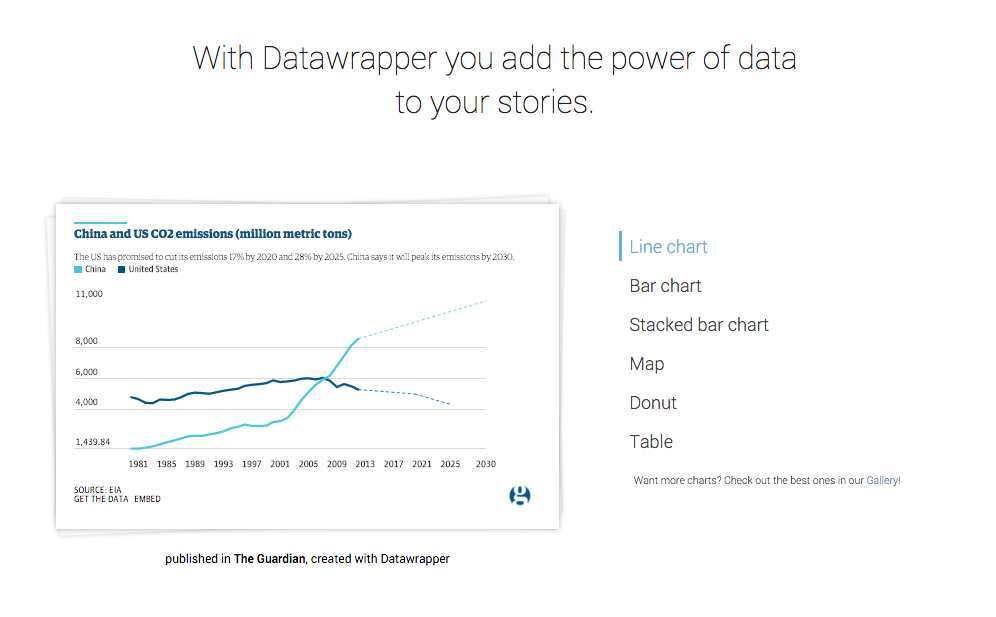
Datawrapper is a great and simple tool to use for creating interactive charts and data visualizations. The great thing about Datawrapper is that the styles of the charts you create will adapt to your fonts, colors and branding styles with ease. It’s a tool commonly used by The Guardian, Bloomberg and other major news publications because of it’s ease of use and accuracy.
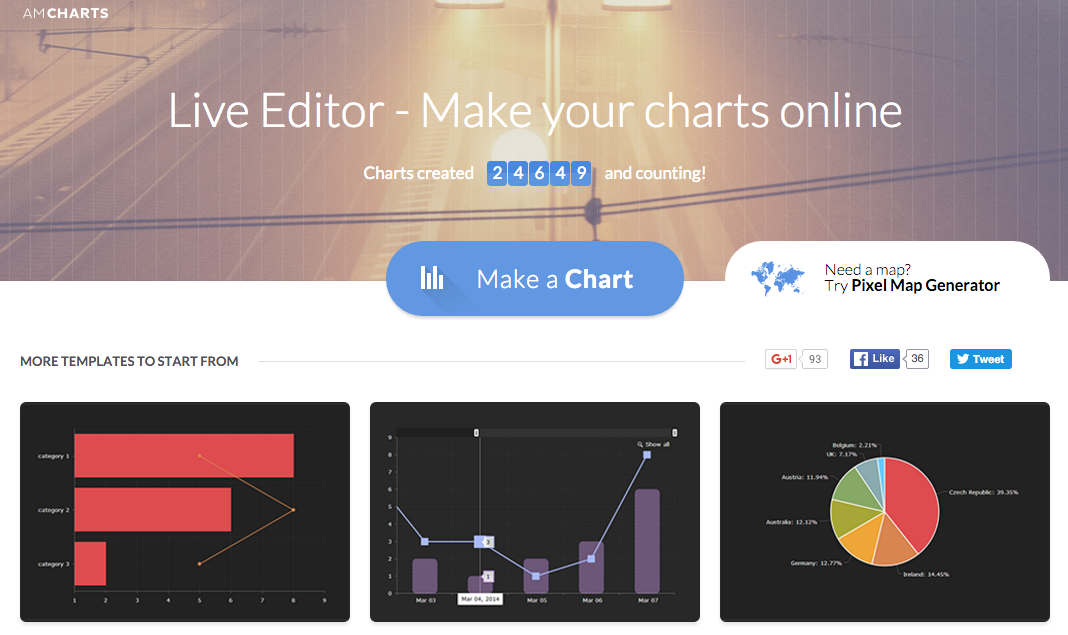
AmCharts is another great online tool with some beautifully designed charts. If you’re looking to visualize your data in a less generic manner, AmCharts might have what you’re looking for. If you want to integrate AmCharts in your own tool, you can access their Javascript chart library.
If you are looking to create a flow chart instead of a bar, pie or line chart, Flow.io is designed so that you can easily drag and drop widgets into your editing canvas. Customize the text and colors to match your branding scheme. This is a great tool to use if you are hoping to chart your company’s process, or to plan out strategies for the future. Their interface resembles that of Google Docs, so getting used to the tool doesn’t take much time.
Visualizing data doesn’t need to be complicated, and the few minutes it takes to plug your data into a chart can save you a lot of extra time explaining to your employees just what those numbers mean. Furthermore, it doesn’t need to cost you anything to create beautiful representations of your metrics. Get your colleagues excited about numbers, not bummed out.
