The US stock market has been on a remarkable run, with major indexes like the S&P 500 hitting fresh all-time highs. However, the gains have been heavily concentrated in a handful of monolithic technology companies, leading some analysts to wonder if over-exuberance is driving valuations into bubble territory.
It turns out that one particular metric, a favorite of legendary investor Warren Buffet, is sending a warning signal that investors may not want to ignore. Let’s dive into what the indicator is saying and what it might mean for the market at large.
The Warren Buffet Indicator and Other Key Metrics
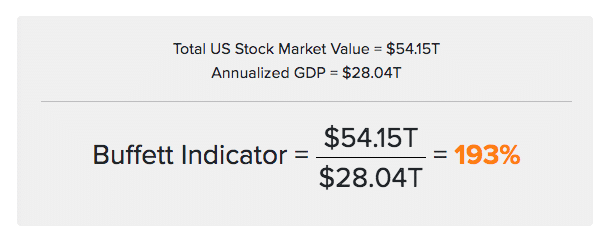
One of the most widely followed valuation measures is the so-called “Warren Buffett Indicator”. This metric compares the total market capitalization of publicly traded U.S. stocks against the country’s gross domestic product (GDP).

Buffett himself has called this “probably the best single measure of where valuations stand at any given moment.” A reading of around 100% is considered fairly valued while a value below 70% could suggest that stocks are undervalued versus the real economy. Meanwhile, anything north of 200% indicates that the risk of a bubble is high.
Currently, the Buffett Indicator is flashing red at 193% – its highest level in two years. The last time it approached this territory was in late 2021 before the S&P 500 dropped 19% over the following year. Other voices like famed investor John Hussman are ringing alarms as well, saying this could be “the most extreme speculative bubble in US financial history.”
Market Concentration & Breadth
Another potential warning sign is the high degree of market concentration among a few mega-cap tech leaders like NVIDIA, Apple (AAPL), Microsoft, and Google’s parent company Alphabet. These top 10 companies now account for over a third of the total S&P 500 market cap.
While their strong earnings justify some premium valuation, the outsized gains that these trillion-dollar tech titans have experienced compared to the broader market are raising eyebrows regarding the sustainability of this latest rally. The situation mirrors the narrowing trend seen in the late 1990s before the dot-com bubble burst.
However, market breadth (the opposite of concentration) has been improving lately, with around 80% of S&P 500 components trading above their 200-day moving averages. This suggests that the uptick is not as narrowly confined as it may seem on the surface.
Leverage Levels
According to research firm TS Lombard, every market bubble needs three key ingredients: “a solid fundamental story, a compelling narrative for future growth, and liquidity, leverage or both.”
While the rise of AI and big tech check the first two boxes, the third component of leverage appears to be lacking so far. Margin debt has barely budged from the levels seen a year ago despite the market’s double-digit gains during that period.
Meanwhile, the volume of call option trading has increased but remains well below the levels seen during the speculative frenzies of 2020 and the dot-com era. This suggests that the rally is being driven more by fundamentals than rampant, debt-fueled speculation – a hallmark of classic bubbles.
“… leverage doesn’t look worrying; margin debt and options open interest suggest that it’s not speculation driving the rally. There has been a small rise in margin debt but nowhere near the highs of 2020.”, said Skylar Montgomery from TS Lombard in a note cited by CNBC.
Valuation Premiums
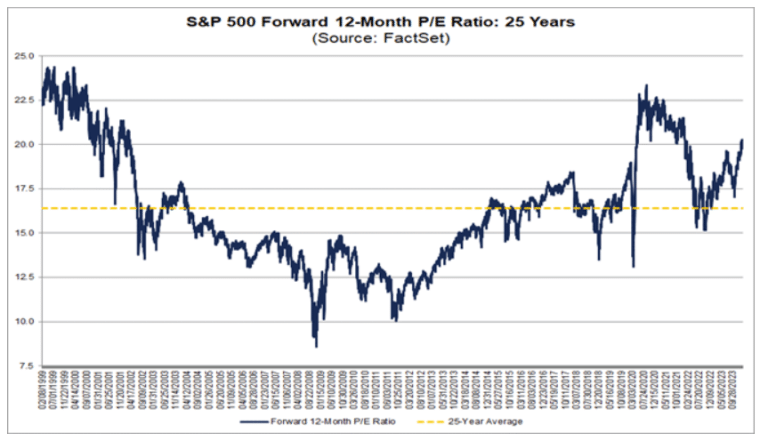
Even bulls admit stocks are trading at a premium compared to historical averages on basic metrics like the price-to-earnings (P/E) ratio. The S&P 500’s forward P/E of 20.5 marks a 30% premium to its long-term average of around 15.8.

However, these valuation gaps are heavily skewed by pricey mega-cap tech stocks trading at nosebleed multiples of over 35x their forecasted earnings. More reasonably priced sectors like financials and healthcare look less egregiously overvalued.
Proponents also argue that comparing today’s index composition to past decades is an apples-to-oranges scenario. The new economy giants have demonstrated superior earnings quality, higher profit margins, and lower debt levels that may justify richer multiples.
“Today’s S&P 500 is half as levered, is higher quality, and has similar or lower earnings volatility than in prior decades.”, commented Savita Subramanian, head of US equity and quant strategy for Bank of America.
The investment professional went on to outright discard the notion that the market is in a bubble. “In our view, this bull market has legs”, Subramanian emphasized.
Productivity & Economic Backdrop
While lofty valuations alone don’t necessarily shout bubble, UBS strategists warn that the current economic landscape looks far less conducive to sustained growth than the booming productivity cycle of the 1990s.
Indicators like business investment, electronics orders, and manufacturing sentiment show few signs of an impending productivity boom to underpin such frothy multiples.
The economy appears to be in a mature and late-cycle stage with real disposable income growth weakening. These conditions are a bit similar to the final stage of the 1990s bull market before its disastrous end. Moreover, buoyant AI adoption may be a positive multi-year force but its impact this year remains uncertain.
Sentiment Checks
Behavioral finance teaches that the rhythm of greed and fear tends to reach alternating extremes during bubbles and busts. Investor sentiment is therefore closely monitored for signs of irrational exuberance or deep pessimism signaling possible market tops and bottoms.
While the “AI euphoria” has arrived for certain pockets of software and semiconductor stocks, Bank of America’s overall gauge of investor sentiment remains stuck in neutral territory – far from the delirious bullishness that has typically marked past peaks.
Subramanian pushes back forcefully on bubble concerns, arguing that this rally is more similar to the healthy start of a new bull in 1995 rather than its feverish 1999 climax when sentiment and valuations became truly unhinged.
How Expert Investors Navigate Frothy Markets
Even if investors avoid a cataclysmic bubble collapse, protracted bouts of inflated valuations can depress portfolio returns over the years. Here are some strategies that experts investors implement to protect themselves from dramatic drawdowns:
- Focusing on value stocks: History shows that relatively cheap value stocks tend to outperform expensive growth names when frothy markets inevitably deflate. Overweighting sectors like energy, financials, and materials can provide some level of insulation if things suddenly go south.
- Invest in alternative assets: Diversifying into real assets like real estate, commodities, or inflation-protected securities can provide a hedge against bubble risk. Precious metals also tend to hold up well during periods of market turmoil.
- Using options as a hedge: Buying index put options can limit the downside for portfolios with a heavy concentration in stocks. The cost can affect returns for a short period but it may be worthwhile when downside risks are considered high.
- Active portfolio management: portfolio allocation strategies involving gradual shifts from certain high-flying sectors to decently valued segments can help mitigate the impact of major drawdowns.
History cautions that major asset bubbles eventually find a stone to stumble on. However, market timing is extremely difficult (if not impossible) and unfruitful according to experts.
Many credible voices dispute if the market has entered bubble territory upon considering the market’s composition, earnings record, and lack of outsized leverage.
While absolute valuations are lofty by most metrics, relative premiums look more justifiable compared to prior instances of rampant overvaluation. The biggest near-term risk may simply be a return to decent yet more pedestrian returns should the AI frenzy inevitably lose some steam.
