In a marketing landscape dominated by digital content, brands that succeed at unlocking the power of video marketing have a significant competitive advantage. When done well, video marketing builds brand awareness and impacts buying decisions like no other content format.
While there’s plenty of research and video marketing data illustrating the impact of video, finding and making sense of all the video marketing stats out there is no easy feat. That’s why in this article, we’ve curated an extensive collection of significant video marketing statistics that illustrate the role video marketing plays in engaging audiences and reaching marketing goals.
Video Marketing Statistics Highlights
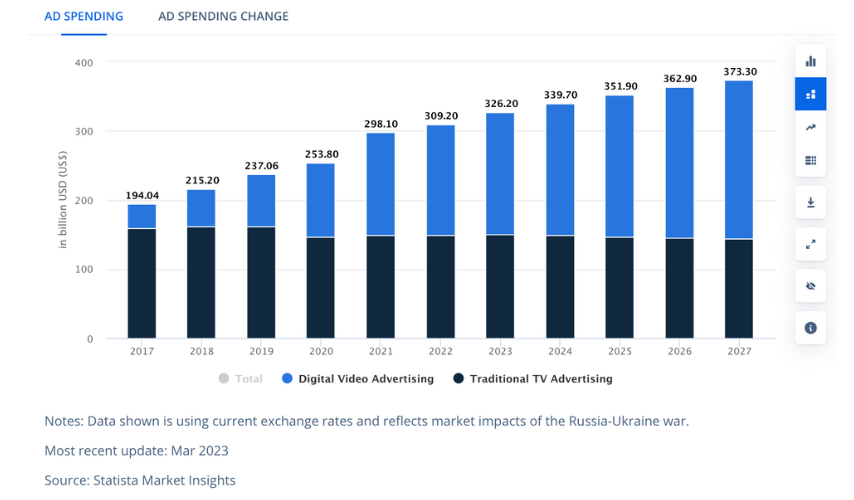
- In 2023, total global ad spend in TV and video advertising is projected to reach $ 326.20 billion.
- The most significant ad spend in video marketing is expected to be in the United States, at $138.00 billion in 2023.
- 60% of shoppers state that online video has inspired their purchases.
- 90% of consumers state that they’ve discovered new brands and products by watching videos on YouTube.
- More than 50% of consumers say that online video has helped them decide which specific brand or product to buy.
Data on Who Uses Video Marketing
86% of all businesses are using video marketing.
U.S. digital video ad spend increased 21% YoY in 2022 to $47.1 billion and was projected to increase by 17% in 2023 ($55.2 billion).
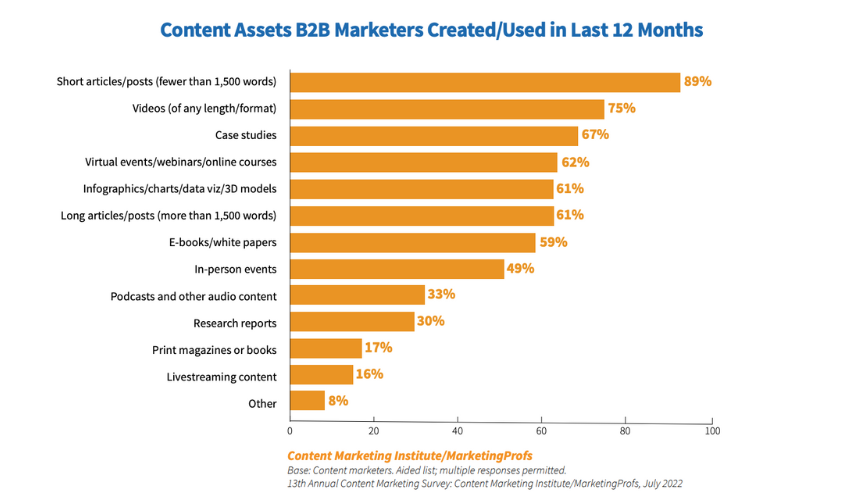
75% of B2B marketers stated that they used video in their marketing campaigns, according to a 2023 report from the Content Marketing Institute.
More than 40% of the US population engaged in daily online video consumption in October 2022.
30% of US adults aged 35 to 54 used their devices to watch a digital video once a week or more.
More than 55% of consumers used online video when shopping in physical stores in 2019, according to research by Google.
In 2021, businesses in the United States spent about $55.3 billion on digital video ads.
According to projections, spending was expected to increase to 78.5 billion by 2023, which is more than double the figure from 2019.
Projections suggest that video ad spending will increase to nearly $80 billion in 2023. Mobile platforms are projected to receive the largest chunk of this investment, as an increasing number of people are watching digital videos on their smartphones.
By 2024, video ads may become the most popular format for mobile ad spend, even surpassing search advertising.
In the same year, users in the US spent around 43 minutes each day watching social video content.
Social video has emerged as a popular form of video content, with 38% of US viewers reporting watching comedy or viral videos during the third quarter of 2022.
Within this group, a majority of users aged 18 to 34, comprising 53%, reported watching online content on a daily basis.
Seasonality plays a part in video consumption – viewers tend to watch video content the most at the start of Q2 and Q4 while watching slows down during the summer.
Common Barriers to Using Video Marketing
91% of companies were using video as a marketing tool in 2023. However, 43% of companies surveyed for a Wistia report did not have a video-specific strategy in place.
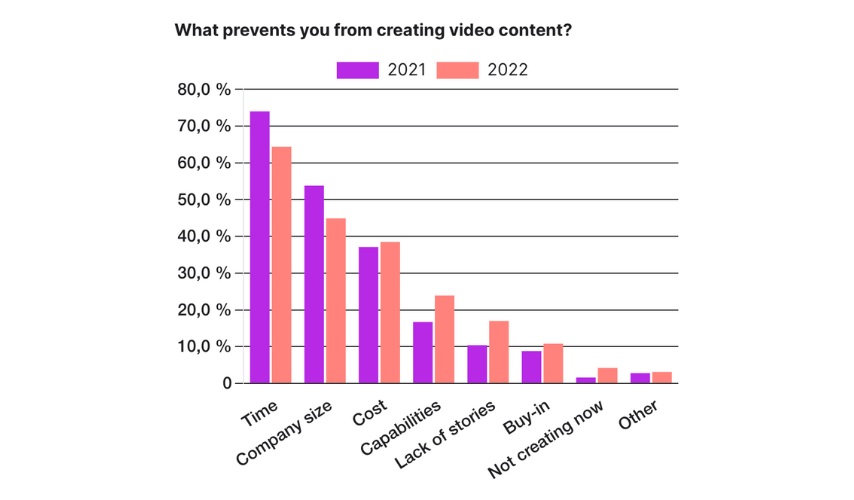
It would be easy to assume that this is because video content is relatively costly to produce compared to other formats, but marketers surveyed for Wistia’s 2023 State of Video report reported other, and bigger, barriers than money for scaling video:
- 64% state that lack of time is the biggest barrier to leveraging video marketing.
- 45% of companies consider insufficient team size to be the obstacle holding them back.
- 18% of marketers don’t know where to start with creating video content.
- 10% have not been able to convince decision-makers to invest in video marketing.
Accessibility in Video Marketing Stats
75% of businesses place high importance on accessibility when sharing videos with their audiences.
- 55% of businesses have added closed captions to their video content to ensure accessibility for individuals with hearing impairments.
- 23% of businesses have implemented audio descriptions, providing detailed narration that helps visually impaired viewers consume the video content.
- 22% of businesses use an accessible player to provide an inclusive viewing experience for all users.
- 21% of the surveyed businesses recognized the significance of global subtitles, to enable viewers speaking different languages to understand their video content.
These video marketing statistics highlight the growing awareness and efforts made by businesses to make their video content more accessible and inclusive.
Goals and Objectives of Video Marketing
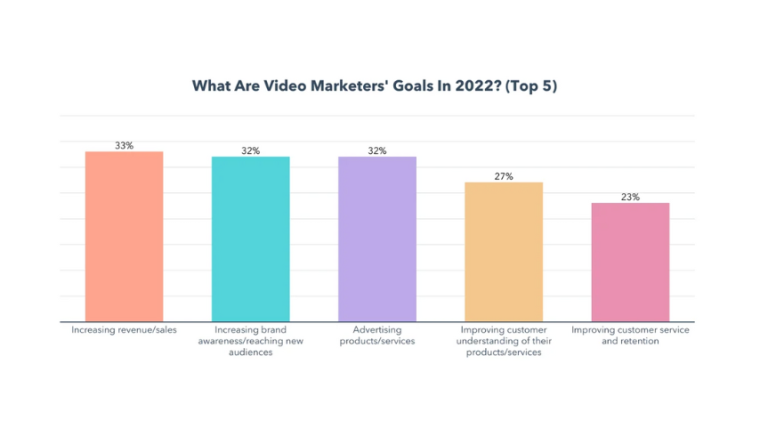
33% of marketers list increasing revenue as their main goal for video marketing.
- 32% of marketers listed raising brand awareness as their main goal for video marketing.
- 32% of marketers said advertising products/services was their main goal for video marketing.
- 23% of marketers used video marketing to improve customer service and retention with video.
Video Marketing and Subscription-Based Streaming Platforms
While search ads still accounted for more than 40% of online ad revenues in the US in 2022, digital video contributed to 22.5% of the country’s total online advertising revenues.
On top of that, the entertainment market and some of the major subscription-based streaming platforms are expected to explore advertising opportunities in the future.
Disney+, for instance, introduced ad-supported subscriptions in March 2022, and Netflix has expressed potential interest in considering taking this route.
As a result, ad-supported video streaming (AVOD) services are projected to experience a significant 16% growth in audience size in 2022, in the US.
Does Video Marketing Work?
Looking at the numbers, it seems safe to say that yes, video marketing works. Let’s have a look at some of the statistics about video marketing that showcases its potential and efficiency when it comes to turning viewers into paying customers.
While this data from Google was collected in 2018, it’s clear from other video marketing statistics that video content has remained a vital element of consumer decision-making.
- 85% of consumers said that product information and pictures are important to them when deciding which retailer or brand to buy from.
- Watch time for YouTube videos on the topic of “which product to buy” has doubled YoY.
- Watch time for YouTube videos related to shopping grew by more than 5 times between 2016-2018 in the US.
- More than 60% of shoppers stated that online video has inspired their purchases.
- More than 50% of consumers said that online video has helped them decide which specific brand or product to buy.
- Watch time for YouTube videos revolving around advice on “when to buy” — for example, “when to buy a car” or “when to buy a house” — increased by more than 100% between July 2017 and July 2018.
- Over 50% of online shoppers stated that they were more likely to visit a store, consider, or actually buy a specific product or service if it had been mentioned in a video.
All in all, video marketing does work. When leveraged well, it helps brands gain exposure, build awareness, drive traffic, and convert traffic into customers.
However, it’s important to note that the success of video marketing is not a given, but is dependent on a number of parameters. Video content quality, understanding of the target audience, choosing the proper distribution strategies, and continuous optimization are all crucial success factors.
In other words, merely publishing videos is not enough. As many as 38% of marketing videos average a total of less than 10,000 views, 16% average as little as under 1,000 views, and only 16% average as high as over 100K views.
Video Marketing Data on ROI
90% of marketers report that video marketing has helped them generate leads, and 87% of respondents stated that video marketing has played a significant role in actually increasing sales, according to Wyzowl’s report The State of Video Marketing 2023.
- 63% of video marketers considered the number of video views to be essential for measuring ROI, reflecting audience reach and overall exposure.
- 61% focused on audience engagement metrics like shares, likes, and comments, indicating the impact and resonance of the content.
- 56% tracked leads and clicks to assess effectiveness in generating conversions and customer interest.
- 43% recognized brand awareness and public relations impact as crucial ROI metrics for assessing overall brand growth.
- 42% prioritized customer engagement and retention metrics, measuring the ability to attract and retain customers.
- 26% used bottom-line sales figures as an indicator of video content’s impact on revenue generation.
- 95% of video marketers stated that video marketing has played a crucial role in increasing brand awareness.
- 91% of video marketers said video marketing has contributed to an increase in website traffic.
- 96% of video marketers reported that video marketing has significantly increased user understanding of their product or service.
- 87% of respondents noted that video marketing has increased dwell time on their website.
- 53% of respondents mentioned that video marketing had helped them reduce support queries.
- 92% of marketers agreed that video marketing provides an overall good return on investment (ROI).
However, 11% of the respondents to the Wyzowl survey stated that they were not actively tracking ROI for video content.
These numbers show how effective video marketing can be in delivering tangible business results. They underline the impact and benefits of video marketing, including lead generation, sales growth, increased website engagement, reduced support queries, and a positive ROI.
Types of Video Marketing Stats
Video Marketing Platforms and Channels
YouTube dominates as the leading video marketing platform, with 90% of video marketers relying on it.
Following closely behind YouTube is Facebook, trusted by 86% of video marketers.
Instagram and LinkedIn are also popular platforms for video marketing, each being used by 79% of video marketers as additional tools in their video marketing arsenal.
Despite initial high expectations, Snapchat has seen limited adoption in video marketing, being utilized by only 13% of brands.
TikTok, on the other hand, is doing better, with a usage rate of 35%.
Twitter, while being an established platform, has relatively low usage as a video marketing tool, with only 54% of marketers including it in their video marketing strategies.
Which Video Marketing Platform is Most Effective?
78% of marketers consider YouTube an effective platform, making it the leader among video marketers in terms of overall effectiveness.
LinkedIn follows closely behind with a rating of 69%, and Instagram comes in third at 67%.
In addition to posting their own videos and engaging with millions of internet users directly, companies are also recognizing the value of user-generated video content (UCG).
The combination of these factors makes social media platforms, including YouTube, Instagram, and TikTok, appealing choices for marketers looking to maximize their reach, engage with a wide audience, and tap into the potential of user-generated content and influencer marketing.
The global influencer marketing market reached a value of $16.4 billion in 2022, which is more than double that of 2019.
Different Types of Video Marketing Content
In 2022, 66% of video marketers focused on producing live-action videos, 57% created screen-recorded videos, and 55% opted for animated videos as part of their video marketing strategies, according to Wyzowl’s report The State of Video Marketing 2023.
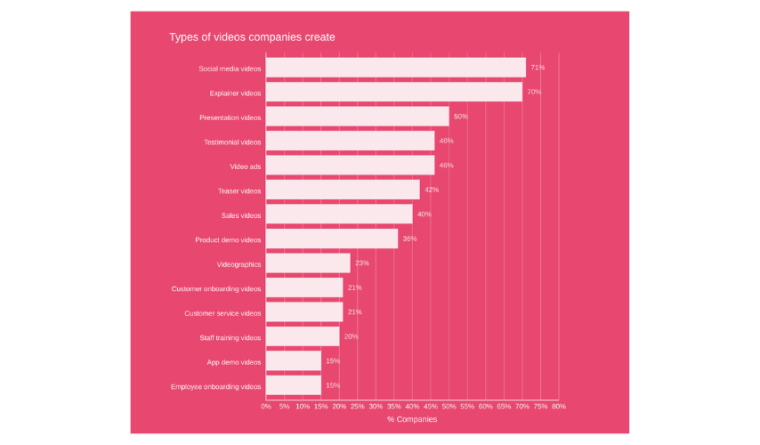
- 71% of marketers focused on creating social media videos, recognizing the power of video content on platforms like Facebook, Instagram, and TikTok.
- Explainer videos, known for their ability to educate and simplify complex concepts, were created by 70% of marketers to convey information effectively.
- 50% of marketers turned to presentation videos to deliver engaging and visually appealing content.
- Testimonial videos, which leverage the power of customer feedback and reviews, were created by 46% of marketers to build trust and credibility.
- Video ads, an essential tool for promoting products or services, were produced by 46% of marketers to capture attention and drive conversions.
- Teaser videos, known for creating anticipation and excitement, were created by 42% of marketers to generate interest in upcoming offerings.
- Sales videos, designed to highlight the value and benefits of a product or service, were created by 40% of marketers to drive purchase decisions.
- Product demo videos, showcasing how products or services work, were used by 36% of marketers to educate and demonstrate their offerings.
- Videographics, combining visuals and data to present information in an engaging way, were created by 23% of marketers to convey complex concepts effectively.
In 2022, 21% of marketers created customer onboarding videos to guide new users and ensure a smooth experience.
- 21% of marketers developed customer service videos to provide assistance and address common queries.
- 20% of marketers created staff training videos to facilitate the onboarding and skill development of their employees.
- 5% of marketers developed app demo videos to showcase the features and functionality of mobile applications.
- 15% of marketers developed new hire onboarding videos, leveraging video content to welcome and integrate new employees into their organizations.
These diverse video formats reflect the versatility and effectiveness of video marketing in capturing attention, educating audiences, and achieving marketing goals in 2022.
The Popularity of Different Types of Video
25% of consumers watch a video made by a brand every month, according to a 2023 report from GWI.
Short-form videos seemed to be the general preference, but long-form videos were appreciated among younger consumers.
93% of surveyed Gen Z consumers had watched a video longer than 20 minutes in the past month, while the corresponding percentage for Boomers was only 56%. 96% 0f the Gen Z consumers surveyed in the study had watched a video shorter than 20 minutes in the past month, while the percentage for Boomers was only 75%.
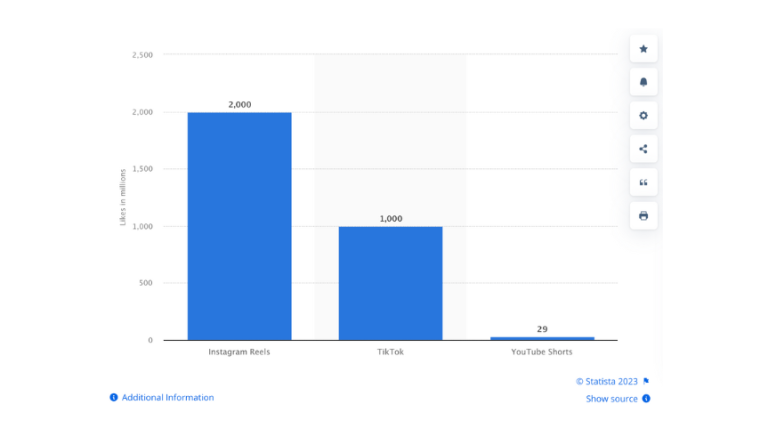
In September 2022, Instagram Reels emerged as the most-liked short video feature, accumulating a significant number of likes.
In contrast, YouTube Shorts content received fewer than 30 million likes from US users during the same month.
In comparison, TikTok, a renowned video sensation, generated an impressive one billion interactions and likes from US users in the same period.
Live streaming is gaining popularity among US audiences, with social media and social video platforms embracing this format.
Instagram and TikTok, in particular, ranked as the most popular platforms among users aged 18 to 34 for watching live content.
This highlights the increasing interest and engagement of younger demographics with live-streaming experiences on these platforms.
Video Marketing Statistics by Country
Video Marketing Statistics: the US
- Ad spending in the US video advertising market is projected to reach $76.97 billion in 2023, with an expected annual growth rate (CAGR 2023-2027) of 8.30%. This will result in a projected market volume of $105.90 billion by 2027.
- In 2027, total ad spending through mobile in the video advertising market will amount to $82.15 billion.
- The average ad spending per internet user is projected to be $246.60 in 2023.
- By 2023, connected TV ad spending in the US is projected to reach $19.30 billion.
- Connected TV is expected to show an annual growth rate of 14.45%, resulting in a projected market volume of $33.11 billion by 2027.
- Ad spending on short-form videos is expected to show an annual growth rate of 13.85% between 2023-2027, resulting in a projected market volume of $56.19 billion by 2027.
- 76% of US marketers emphasize the importance of connected TV advertising, deeming it a must-buy for their media plans.
- Over half of US marketers consider social video as an essential investment, recognizing its value in reaching and engaging audiences.
- In the same survey, 50% of respondents identified national broadcast and cable TV as must-buy advertising channels.
Video Marketing Statistics: Europe
- The European video advertising market is projected to reach a total ad spending of $23.95 billion in 2023.
- Ad spending is expected to grow at an annual rate of 4.74% (CAGR 2023-2027), resulting in a projected market volume of US$28.82 billion by 2027.
- Mobile ad spending in the video advertising market is estimated to contribute $22.08 billion to the total ad spending in 2027.
- In 2023, the average ad spending per internet user in the European video advertising market is projected to be $32.99.
- The projected ad spending on connected TV in the video advertising market is $2.77 billion in 2023.
- Connected TV is expected to grow at an annual rate of 6.35% in 2023-2027, resulting in a projected market volume of $3.54 billion by 2027.
- Ad spending on short-form videos in the video advertising market is projected to reach $10.40 billion in 2023.
- The ad spending on short-form videos is expected to grow at an annual rate of 10.33%, resulting in a projected market volume of $15.41 billion by 2027.
Video Marketing Statistics: Asia
- The Asian video advertising market is anticipated to witness significant growth, with ad spending projected to reach $62.46 billion by 2023. Over the period of 2023 to 2027, it is expected to exhibit a compound annual growth rate of 5.87%, resulting in a market volume of $78.47 billion by 2027.
- The average ad spending per internet user in the Asian video advertising market is projected to reach $19.72 in 2023.
- The market for connected TV advertising is expected to experience strong growth, reaching $6.41 billion in 2023. It is projected to maintain a strong annual growth rate of 9.71% from 2023 to 2027, resulting in a market volume of $9.29 billion by 2027.
- Short-form videos are predicted to attract a significant share of ad spend in the Asian video advertising market, with a projection of $38.88 billion in 2023.
Video Marketing Statistics: India
- Ad spending in the Indian video advertising market is projected to reach $1.24 billion in 2023, with an expected annual growth rate (CAGR 2023-2027) of 5.67%. The projected market volume is $1.54 billion by 2027.
- In 2027, $1.32 billion of total ad spending in the Indian video advertising market will be generated through mobile.
- The average ad spending per internet user in the Indian video advertising market is projected to be $1.23 in 2023.
- Connected TV ad spending in the Indian market is projected to reach $71.13 million in 2023, with an expected annual growth rate of 5.33%. The projected market volume is $87.56 million by 2027.
- Ad spending on short-form videos in the Indian market is projected to reach $461.30 million in 2023, with an expected annual growth rate of 7.50% in the same period. The projected market volume is $616.10 million by 2027.
FAQs
Is video the future of marketing?
What does video do for marketing?
How do you analyze video marketing?
References
- Statista
- Think With Google
- Think With Google
- Wyzowl
- Iab
- Content Marketing Institute
- GWI
- Statista
- Think With Google
- Statista
- Statista
- Statista
- Statista
- Wistia
- Hubspot
- Statista
- Statista
- Think With Google
- Think With Google
- Think With Google
- Think With Google
- Think With Google
- Think With Google
- Statista
- Statista
- Statista
- Statista
- Statista
- Statista
- Statista
