Variance analysis helps business owners and professionals monitor discrepancies in performance, allowing them to maintain a competitive edge. Whether you’re tracking sales, employee efficiency, or overhead costs, variance analysis unlocks the power of data-driven insights, ensuring you can optimize your operations, maximize profits, and achieve sustainable growth.
To help you leverage this essential resource, our expertise at Business2Community will guide you through everything you need to know about variance analysis, including its use cases, how to perform it, and how to address its key limitations.
Variance Analysis – Key Takeaways
- Variance analysis compares actual outcomes to planned results and identifies key variances across business functions like finance, marketing, and sales.
- As a quantitative method, it provides valuable data, enabling informed decision-making, strategy improvements, and enhanced business operations.
- For relevant and actionable insights, variance analysis should be combined with other KPIs and non-financial metrics.
What Is a Variance Analysis?
Variance analysis is a quantitative method that compares actual results to planned results, ensuring any differences (variances) can be identified and addressed.
For businesses, variance analysis provides a clear view of overperformance and underperformance. It highlights successful strategies and areas of efficiency that can be replicated, while flagging areas where improvements are necessary to achieve business goals.
Who Needs to do a Variance Analysis?
Business owners and professionals across various business departments, including finance, production, marketing, HR, and sales, should use variance analysis to gain insight into overall performance. This allows them to make informed decisions, adjust strategies, and implement corrective measures to align business operations to strategic goals.

Variance Analysis Use Cases
While it is commonly associated with manufacturing and production processes, variance analysis can be applied to other key business areas such as marketing, sales, human resources, and project management.
Marketing
Key use cases: Assessing campaign effectiveness, analyzing budget variances, evaluating marketing ROI, and measuring impact on sales and market share.
Say a $50,000 social media campaign planned for a 30% boost in website traffic but only achieved a 15% increase. A variance analysis would highlight this difference, empowering a business owner to investigate potential causes, such as platform selection, targeting strategies, or market shifts, and adjust their efforts accordingly.
Sales
Key use cases: Analyzing sales forecast accuracy, evaluating sales strategies, and assessing sales team performance.
Suppose actual sales for a particular month were $10,000, compared to the projected figure of $20,000. A variance analysis would pick up this shortfall, prompting a sales manager to investigate market shifts, sales team performance, or pricing strategies, and take corrective action.
Human Resources
Key use cases: Monitoring labor costs, evaluating employee productivity, and analyzing training effectiveness.
Consider a scenario where a certain task required 1,000 labor hours but took 1,200 hours. A variance analysis would detect this difference, enabling an HR manager to investigate potential reasons for the discrepancy (low employee productivity, inadequate training, or unforeseen task complexities) and address them.
Project Management
Key use cases: Budget tracking, schedule adherence, resource allocation efficiency, risk management, quality control, and team evaluation.
A project is expected to take 12 months and cost $1 million, however, after 6 months it is only 30% done with costs totaling over $700,000. A variance analysis would reveal this difference, alerting a project manager to investigate scope changes, resource availability, technical challenges, or estimation errors, and bring the project back on track.
How to Perform a Variance Analysis
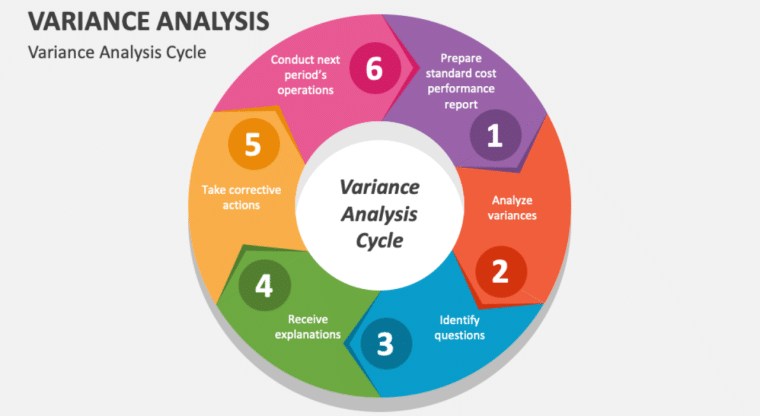
Performing variance analysis involves the following steps:
- Determine what aspects of your business performance you want to understand.
- Gather the budgeted and actual financial data for the period you want to analyze.
- Calculate the variances using the appropriate formula for each type of variance. (Provided in the “Variance Types and Formulae” section below)
- Analyze variances and classify them as favorable or unfavorable based on their impact on business performance.
- Investigate the reasons behind the variances.
- Take corrective action and engage in strategic planning to address unfavorable variances and leverage favorable ones.
- Continuously monitor any corrective actions and adjust them as needed.
As variances can change from one reporting period to the next, it’s best to perform variance analysis monthly to ensure ongoing improvement.
When analyzing variances, reviewing them on a trend line is particularly helpful. This allows you to see the “big picture” and identify major changes in variance levels across reporting periods and business departments.

Variance Types and Formulae
There are different types of variances you can use to gain a deeper understanding of your business. Income statement data, which focuses on fluctuations in sales and expenses, is a common starting point for variance analysis.
However, to get the most value out of variance analysis, focus on variances that match your operations and business model. For example, if you’re a service business, focus on labor variances as these can reveal inefficiencies or opportunities in your workforce.
If you sell products, material and overhead variances may be more useful, as they can highlight issues or potential improvements in production and resource allocation.
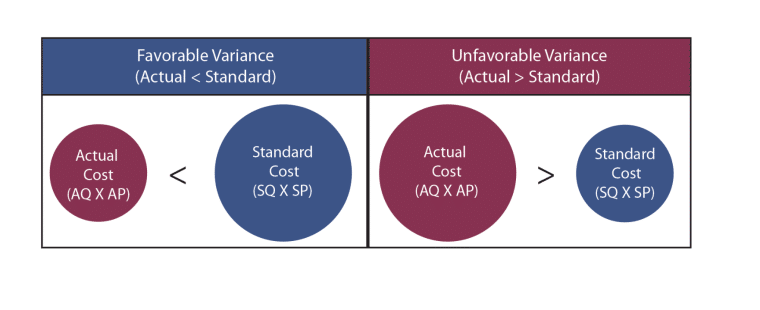
Variances can either be favorable or unfavorable. A favorable variance occurs when actual results exceed budgeted figures.
This indicates better-than-expected performance, cost savings, or other positive outcomes. For example, a favorable budget variance implies that a business is using its resources optimally, controlling fixed costs effectively, and pricing its products competitively.
On the other hand, an unfavorable variance occurs when actual numbers fall short of budgeted expectations, suggesting potential inefficiencies, higher costs, or other challenges.
Basic Variance
At the most basic level, variance calculations involve subtracting a planned or budgeted amount from an actual amount. So,
Actual Amount – Budgeted Amount = Variance
However, when analysis includes multiple data points, such as prices, rates, quantities, or total variance, calculations become more complex.
Whether you want to track overhead costs, cash flow, or marketing performance, we’ve provided some of the most common variances to help you manage your business effectively.
Revenue Variance
Revenue variance is the difference between actual revenue and budgeted or expected revenue. It helps businesses understand the effectiveness of their revenue generation efforts and take action to boost profitability.
Formula: Actual Revenue – Budgeted Revenue = Revenue Variance
Marketing Cost Variance
Marketing cost variance is the difference between actual and standard marketing expenses for a specific period which helps assess the efficiency of marketing campaigns and resource allocation.
Formula: Actual Marketing Cost – Standard Cost = Marketing Cost Variance

Cash Flow Variance
Cash flow variance compares actual net cash flow and projected net cash flow. Analyzing cash flow variance provides valuable insights into a business’s liquidity and financial health, enabling better financial planning and decision-making.
Formula: Net Actual Cash Flow – Budgeted Net Cash Flow = Cash Flow
Sales Variance
Sales variance is the difference between actual sales and budgeted sales for a certain period. It provides insights into sales performance and facilitates effective resource allocation and strategy adjustments.
Formula: Actual Sales – Budgeted Sales = Sales Variance
Sales Volume Variance
Sales volume variances measure the difference between actual and budgeted sales volumes, highlighting sales volume discrepancies and aiding in better financial planning and decision-making.
Formula: (Actual Quantity Sold – Budgeted Quantity Sold) x Standard Selling Price per Unit = Sales Volume Variance
Sales Price Variance
Measures the difference between the actual price paid and the budgeted selling price, indicating the effectiveness of pricing strategies.
Formula: (Actual Selling Price per Unit – Standard Selling Price per Unit) x Actual Quantity Sold = Sales Price Variance
Labor Variance
Labor rate variance is the difference between the actual cost of labor versus the expected direct labor cost. It monitors direct labor costs, assisting in cost management and labor rate optimization.
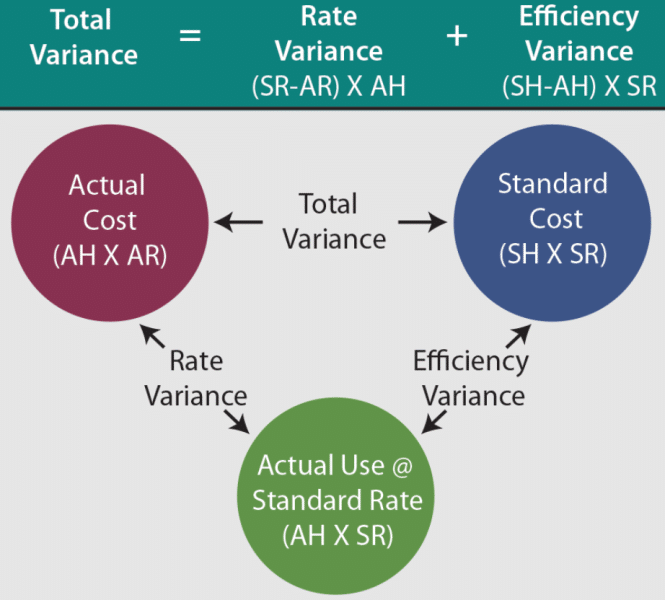
Formula: (Actual Labor Rate – Standard Labor Rate) x Actual Hours = Labor Rate Variance

Labor Efficiency Variance
Labor efficiency variance compares the actual hours worked to the standard hours expected for the production output. It flags workforce productivity changes, guiding labor management for enhanced operational efficiency.
Formula: (Actual Labor Hours – Standard Hours) x Standard Labor Rate = Labor Efficiency Variance
Material Quantity Variance
Material variance is the difference between the actual quantity of raw materials used in production and the standard quantity. It pinpoints material usage discrepancies, supporting efficient resource and cost control.
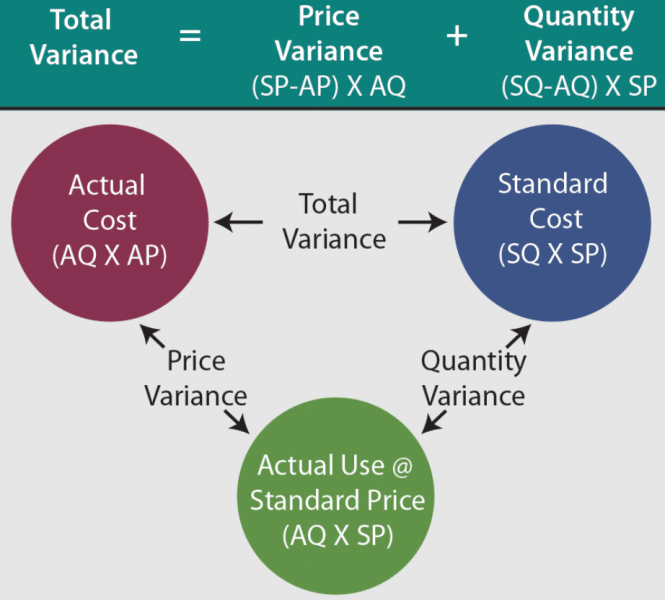
Formula: (Actual Quantity – Standard Quantity) x Standard Price = Quantity Variance
Fixed Overhead Variance
This measures the gap between fixed actual overhead costs and budgeted overhead costs, enabling efficient cost management and budgeting.
Formula: (Actual Output x Standard Fixed Overhead Rate – Actual Fixed Overheads) = Fixed Overhead Variance
Variable Overhead Variance
This specific expense variance measures the difference between the actual variable overhead costs and budgeted variable overhead costs. It helps identify cost fluctuations, enabling cost control and improvements to operational efficiency.
Formula: (Actual Variable Overhead Rate per Unit − Standard Variable Overhead Rate per Unit) x Actual Activity Level = Variable Overhead Spending Variance
Examples of Variance Analysis
Dive into these examples to learn how you can use variance analysis to gain insights into your own revenue and sales performance.
Tracking Revenue
It’s your first quarter in business as an online fitness instructor and you’d like to track your actual revenue against your forecasted revenue. You projected revenue of $30,000 for the quarter, and actual revenue is $42,000.
To calculate revenue variance:
Actual Revenue – Budgeted Revenue = Revenue Variance
$42,000 – $30,000 = $12,000
As $12,000 is a positive number, the variance is favorable and suggests that you’re off to a great start. Further analysis could be used to uncover and replicate your strategies, ensuring continued momentum beyond the first quarter.

Monitoring Sales Performance
Your organic food business recently launched a new product. You planned to have income of $10,000 from 200 units sold. However, according to your accounting team, actual sales for the period amounted to $8,000 for 160 units sold.
To calculate sales variance:
Actual Sales – Projected Sales = Sales Variance
$8,000 – $10,000 = – $2,000
As -$2000 is a negative number, the variance is unfavorable, and further investigation is required to identify and address the reason behind lower-than-expected sales.
Evaluating Labor Efficiency
It’s the end of a production cycle and you want to assess labor efficiency.
- The standard hours to produce 100 units is 200 hours.
- The standard labor rate is $20 per hour.
- However, the actual hours worked to produce these units is 220 hours.
To calculate labor efficiency variance:
(Actual Labor Hours – Standard Hours) x Standard Labor Rate = Labor Efficiency Variance
(220 hours – 200 hours) x $20 = $400
Since $400 is a positive number, more labor hours were required than expected. This suggests lower labor efficiency and further investigation is needed to identify and address potential issues in the production process.
How to Influence Your Variance Analysis
To ensure variance analyses provide an accurate view of your business performance:
- Use accounting software to enhance the accuracy of financial statements and reduce accounting errors.
- Align your standards with industry benchmarks to maintain realistic expectations and avoid incorrect values.
- Develop systems to collect and combine data from various departments for streamlined and comprehensive variance analyses.
- Use standardized formulae and procedures to ensure consistency across different periods and departments.s
To positively influence specific variances, consider the following measures:
- Sales variance: Increase your sales enablement efforts, optimize pricing, and enhance your promotional strategies.
- Revenue variance: Enhance customer acquisition and retention strategies, explore new market segments, and improve your product or service offerings.
- Overhead variance: Streamline your operational processes, manage accounts payable efficiently to negotiate lower prices with suppliers, and implement cost-saving measures to reduce your overhead expenses.
- Efficiency variance: Invest in employee development, use project management software, and leverage technology and AI to improve workflow efficiency.
- Marketing variance: Adjust marketing campaigns according to performance metrics, leverage data-driven insights for targeted advertising, use AI, and explore innovative marketing channels to maximize your marketing returns.
Limitations of Variance Analysis
While it is a valuable tool, variance analysis has its limitations. In many organizations, the accounting staff only compiles variances at the end of a certain period, usually quarterly or yearly.
In today’s competitive environment, this time delay can lead to missed opportunities or delayed corrective actions. Empower your management team to make informed decisions and manage uncertain economic conditions by conducting a variance analysis monthly.
Variance analysis can’t pinpoint the causes of variances. Further investigation is required to understand and address performance issues. For a more comprehensive view of business performance, integrate variance analysis with key performance indicators (KPIs) and non-financial metrics.
Although variance analysis offers valuable insights into past performance, it can leave a business unprepared for future challenges and opportunities. Its focus on historical data overlooks emerging trends and market shifts, limiting its ability to guide forward-looking decisions.To address this, supplement variance analysis with forward-looking techniques such as trend analysis, scenario planning, or predictive modeling.
The Value of Variance Analysis
By comparing budgeted and actual figures, variance analysis uncovers key performance deviations, allowing businesses to refine their processes, allocate resources efficiently, and make informed decisions.
Ultimately, setting realistic standards, capturing quality data, and consistently performing variance analyses will ensure your business thrives in an increasingly competitive landscape. For an even greater edge, combine your approach with KPIs, non-financial metrics, and predictive tools like trend analysis and scenario planning.
