For business owners and decision-makers, univariate analysis is among the best statistical methods to uncover insights into individual aspects of business operations, customer behavior, or market trends. Whether it’s adjusting your pricing strategies based on average sales data, or tailoring your marketing efforts to the most common customer age group, univariate analysis allows you to make specific adjustments to drive business success.
To help you leverage this valuable technique, we’ll be using our expertise at Business2Community to guide you through everything you need to know about univariate analysis. Keep reading to discover its key use cases, limitations, practical examples, and more.
Univariate Analysis – Key Takeaways
- Univariate analysis explores a single variable at a time to uncover characteristics such as averages, ranges, and variability.
- By describing data and visualizing it through tables and charts, univariate analysis enables decision-makers to spot trends and allocate resources effectively.
- Regularly conducting univariate analyses and integrating them with other analytical methods allows you to align your strategies with market dynamics for continued success.
What Is Univariate Analysis?
Univariate analysis is a form of statistical analysis that focuses on only one variable at a time to describe, summarize, and reveal patterns in data. It can be used to analyze all different kinds of metrics and variables to provide valuable insights.
Who Needs to Do a Univariate Analysis?
Anyone wanting to understand the characteristics of a single variable can benefit from univariate analysis. Through figures such as averages, ranges, or standard deviations you and your business’s decision-makers can get insights into a particular aspect of your business, enabling strategic planning and resource allocation.
For example:
- Business analysts and researchers use univariate analysis to understand individual variables before diving into more complex statistical tests or multivariate analyses.
- Entrepreneurs and solopreneurs use univariate analysis to gain deeper customer insight (demographics, habits, satisfaction levels) to inform business strategies.
- Production and operations managers assess metrics like defect rates, production time, or costs per unit to optimally manage resources, product quality, costs, and overall efficiency.
- Marketing and sales professionals explore variables like customer demographics, product preferences, and individual sales metrics to guide more targeted strategies.
- HR managers and professionals analyze variables like employee demographics or sales per employee to guide efficient planning, decision-making, and resource allocation.
- Finance managers, analysts, and professionals analyze, describe, and visualize individual financial metrics or KPIs for better tracking, planning, and decision-making.
Univariate Analysis vs Multivariate Analysis
Univariate analysis focuses on one variable to understand its characteristics. On the other hand, multivariate analysis focuses on three or more variables to understand the relationships and interactions between them.
Univariate Analysis Use Cases
As one of the simplest statistical methods for analyzing data, univariate analysis focuses on variables in isolation to understand them better. This makes it perfect for a broad range of use cases such as:
Spotting Trends
A sales manager might use univariate analysis to identify patterns in sales data such as months with the highest versus lowest sales or average sales for a particular period (weekly, monthly, yearly), allowing for better pricing strategies, inventory management, strategic planning, and resource allocation.
Resource Planning
By analyzing variables such as gender, age, or educational background, an HR manager can make informed decisions and devise more effective human resources strategies.
Optimizing Performance
Univariate analysis can help decision-makers optimize performance in various areas such as:
- Conducting consumer or market research to tailor marketing strategies.
- Assessing marketing metrics like shares or comments on a social media platform to gauge audience engagement and optimize content effectiveness.
- Evaluating individual employee performance metrics to ensure greater efficiency and productivity.
- Visualizing the output of production machines to assess their performance and maintenance needs.
How to Perform Your Univariate Analysis
Now it’s time to dive into the 5 simple steps you need to follow to conduct a univariate analysis.
Step 1: Define Your Objectives
First, clearly define what you want to understand from the univariate data analysis you’ll perform. What is your research question and what types of data do you want to collect and analyze? A variable is simply a condition or a category that your data falls into, for example, “weekly website visits”, “sales”, or “daily hours worked”.
Understanding the type of variable you’re working with is crucial for choosing the right analysis method and interpreting the data correctly.
Possible values can be categorical, numerical, or nominal variables:
- Numerical variables: Also known as continuous variables, these are quantifiable values, such as your company’s daily sales figures or a customer’s age, used for mathematical and statistical calculations.
- Categorical or nominal variables: Nominal variables represent data that isn’t a measurement, such as product types in a store or payment methods used by your customers.
- Ordinal variables: Ordinal variables refer to data with a meaningful order, like customer satisfaction ratings or employee performance levels.
Step 2: Gather Your Data
Collect the relevant data for all the variables you’re interested in. If your data is numerical, ensure your measurement units are consistent. Check for missing data, errors, or inconsistencies in the data and decide how to address them.
For future reference, consider creating a document or codebook to:
- List variable names and what each variable name measures or represents.
- State what each of the variables means if the meaning isn’t obvious (e.g. if there are numbers assigned to gender).
- Describe the level of measurement, e.g. nominal, ordinal, or interval.
- Note any special details about your variables.
Step 3: Organize Your Data
After gathering your data, the next step is to organize it. This involves calculating univariate descriptive statistics for each variable of interest. The methods you can use will be determined by the type of data gathered.
For numerical data such as revenue figures or customer ages, calculate measures of central tendency (mean, median, and mode) and dispersion (range, variance, and standard deviation).
For categorical data such as product categories or customer types, you can conduct a frequency analysis to see how often each category occurs.
Measures of Central Tendency
Measures of central tendency pinpoint average or common values in a data set and are essential for spotting trends and making informed business decisions.
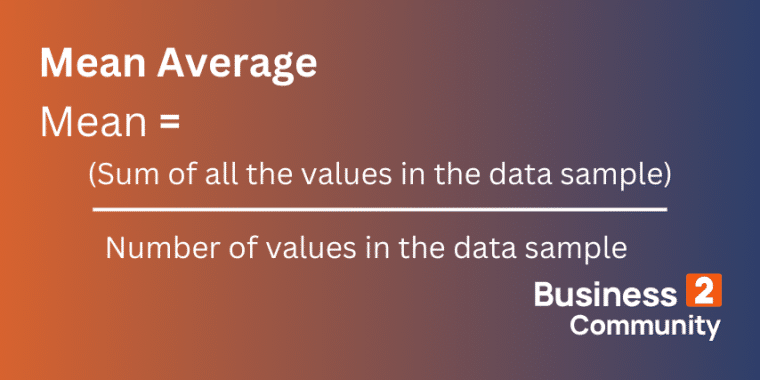
- Mean: This is a value calculated by adding all the values in your data sample and dividing that total by the number of values in your data sample. Key use cases may include calculating average sales, typical customer satisfaction scores, or average employee salaries.
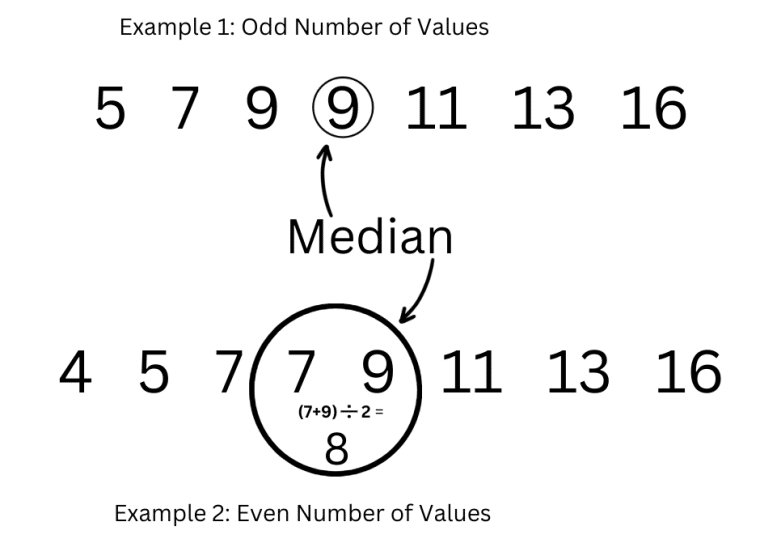
- Median: This represents the middle value in your data set when values are arranged in ascending order. It’s best used to understand typical values while avoiding the skewing effects of extremely high or low values, or outliers.
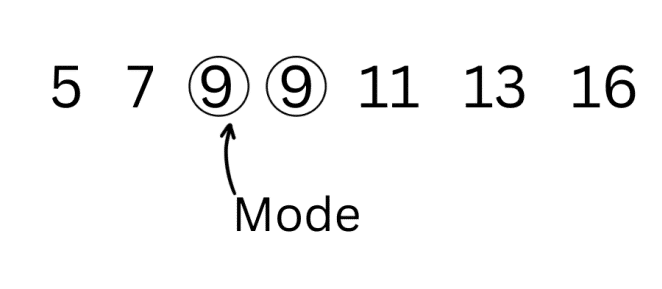
- Mode: This is the value that occurs most frequently in a data set. Key use cases may include identifying the most commonly purchased product or the most frequently reported service issue.
Measures of Dispersion
Measures of dispersion reveal the degree of diversity or consistency in data, which is crucial for risk assessment, decision-making, and strategic planning.
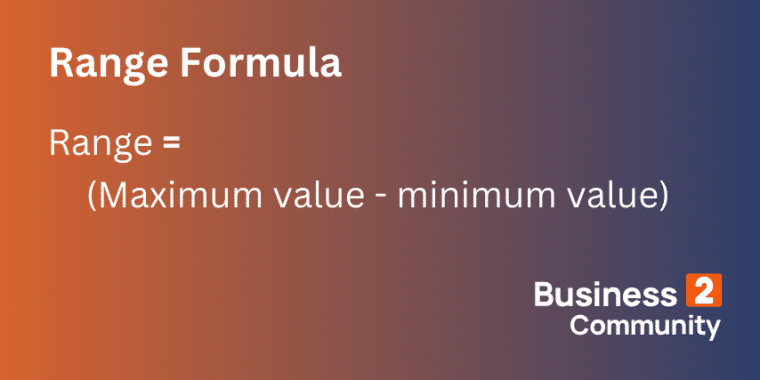
- Range: The difference between the highest and lowest value in your data set. Key use cases may include understanding the spread of customer and employee ages.
- Interquartile Range: The difference between the top 25% and bottom 25% of your data, calculated by subtracting the value at the first quartile (Q1) from the value at the third quartile (Q3). By analyzing middle values, it minimizes the impact of outliers.

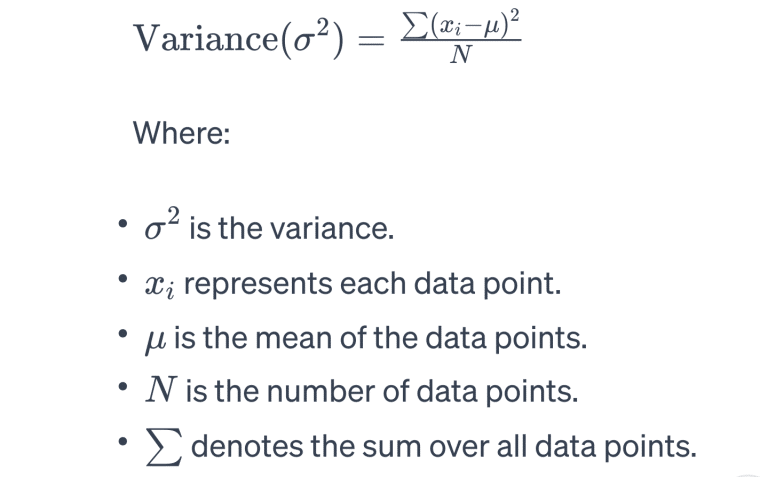
- Variance: Measures how spread out your data is around the mean and is calculated by averaging the squared differences between each data point and the mean. It is particularly helpful for understanding how much variation exists in performance metrics like production costs or employee efficiency.
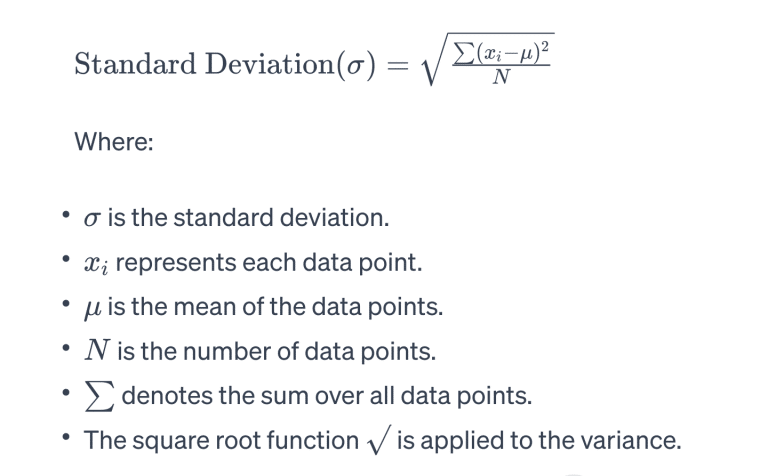
- Standard deviation: This is the average distance of each data point from the mean, calculated by finding the square root of the variance. It is commonly used to evaluate the consistency of metrics like monthly sales, customer traffic, or quality.
Frequency Analysis
A frequency analysis involves counting the number of occurrences for each category of data analyzed. This is best done through frequency distributions, also known as frequency tables or frequency distribution tables, which provide a clear and organized view of your findings.
Step 4: Prepare Visuals
Once you’ve organized your data, the next step is to represent it visually to help you interpret your findings more effectively. Again, the type of data will help you determine the most appropriate visualization method.
Visualizing Categorical Data
For nominal and ordinal variables, bar graphs and pie charts are often best.
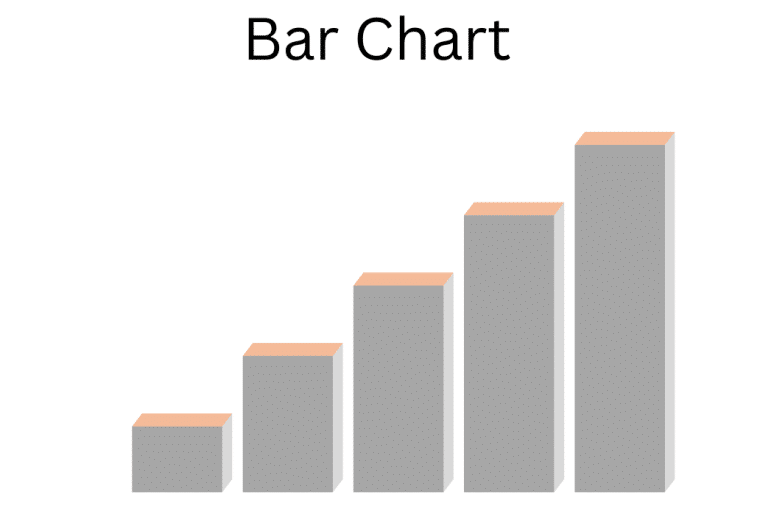
- Bar charts: A bar graph or bar chart is useful for making comparisons between categories of data or different groups of data and tracking changes over time.
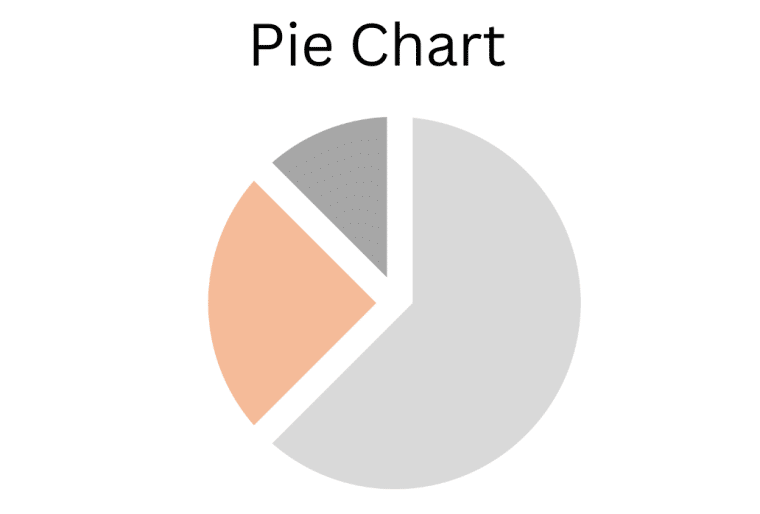
- Pie charts: A pie chart shows a dataset divided into different parts amounting to 100% and slices represent a particular category’s percentage share. It is useful for making quick comparisons between categories and understanding the importance of each category relative to your entire dataset.
Visualizing Numerical Data
For numerical values, bar charts are also suitable, along with histograms, frequency polygons, and line charts.
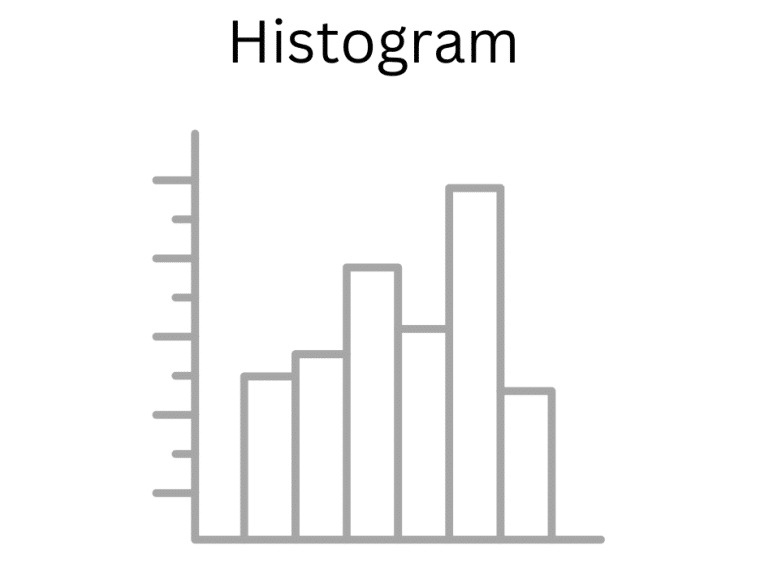
- Histogram: Groups data into intervals and displays the number of values in each interval, making it ideal for larger data sets.
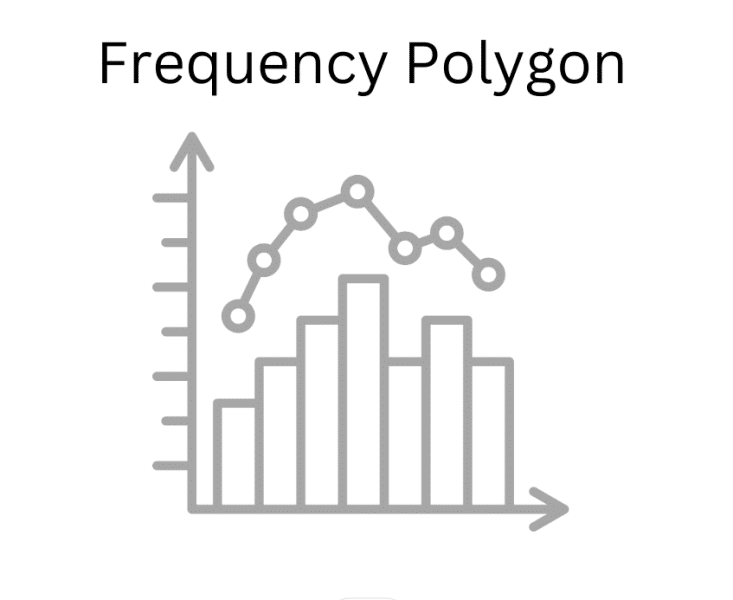
- Frequency polygons: A frequency polygon is similar to a histogram but instead of bars, it uses a line to connect points representing the frequency of each interval.
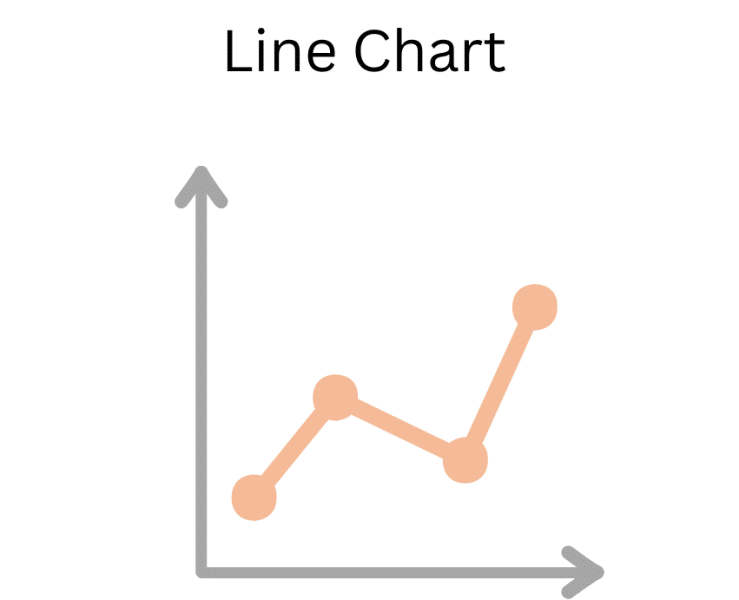
- Line chart: A line chart tracks changes in a variable over time, making it ideal for visualizing trends and patterns in time-series data.
Step 5: Draw Conclusions
In the last step, interpret what your data is telling you about each variable and determine its impact on your business. For added context and insight, track how the variables have changed over time. Lastly, compile univariate statistics regularly to help maintain performance, refine strategies, and support ongoing business growth.
Examples of Univariate Analysis
Below, we explore two examples of univariate analysis that you can use to evaluate specific business areas.
Example 1: Frequency Analysis of Product Categories
A bookstore owner wants to identify the best-selling book category for the month. The shop assistant compiles the necessary data and reports it to the owner in a frequency table.
- Fiction: 120 sales
- Non-fiction: 100 sales
- Mystery: 80 sales
- Science fiction: 90 sales
- Biography: 75 sales
- Children’s books: 60 sales
The table shows each category and the corresponding number of sales.
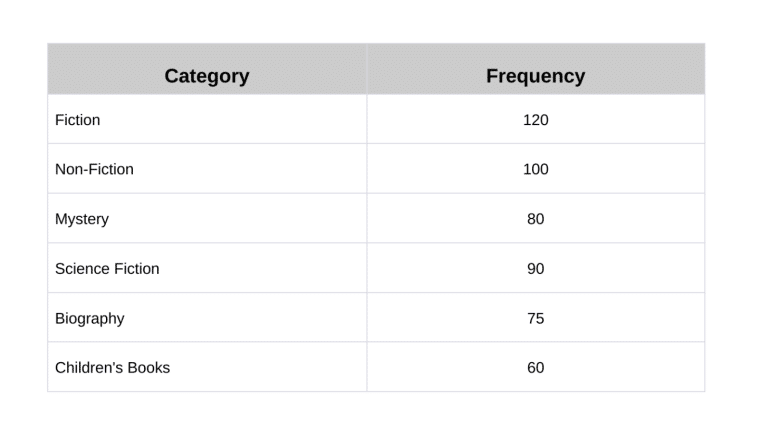
Conclusion: The best-selling category for the month is fiction, with 120 sales.
Example 2: Central Tendency Analysis of Sales Revenues
A sales manager of an online store wants to evaluate bi-annual sales performance. Using sales totals from the first six months of the year, the manager starts their analysis:
- Month 1: $6,000
- Month 2: $8,000
- Month 3: $8,000
- Month 4: $11,000
- Month 5: $9,000
- Month 6: $12,000
The measures of central tendency are:
- Mean: [(6000+ 8000+ 8000 + 11000+ 9000+ 12000)/6] = $9,000
- Median: The middle value in the ordered sales data is $9,000.
- Mode: The most frequent sales figure in the data set is $8,000.
Conclusion: Average sales for the first six months were $9,000. Based on the previous year’s average of $13,000, the sales manager concludes that sales performance has decreased and works to address the reasons behind the decline.
How to Adjust a Univariate Analysis
Because univariate analysis focuses on single variables, you can make quick adjustments to improve specific business concerns. For example, if your analysis reveals that monthly expenses are increasing, you can employ cost-cutting measures to get them under control. Similarly, if you uncover that your biggest customer complaint is slow delivery, you can take corrective action to boost customer satisfaction.
Generally, for a more effective univariate analysis:
- Make sure your data is accurate, complete, and relevant as poor-quality data can lead to misleading analysis.
- For more balanced and accurate interpretations, always consider the business implications of your data.
- Where possible, compare findings with historical data to identify trends and changes over time.
Limitations of Univariate Analysis
A major limitation of univariate analysis is that it doesn’t look at more than one variable at a time, so it doesn’t reveal relationships between variables. Understanding the interactions between multiple variables can be essential for certain questions, as relying solely on univariate analysis can overlook the complexity of business systems and lead to oversimplified conclusions.
To address this limitation, use univariate analysis as the first step to more complex statistical tests and quantitative data analysis methods such as correlation or multiple regression analysis.
Correlation analysis is particularly useful in business contexts as it examines the relationships between two variables. For example, it can help you understand how a dependent variable like sales revenue changes when an independent variable like marketing spending changes.
Multiple regression analysis takes this further by simultaneously examining the influence of multiple independent variables such as marketing spend, market trends, and customer demographics on sales revenue.
For a more comprehensive analysis tailored to your business’s specific context, consider integrating the following analysis techniques:
- SWOT analysis: Offers a comprehensive view of your business’s strengths, weaknesses, opportunities, and weaknesses, enabling strategic planning and decision-making.
- Scenario planning: Considers potential future scenarios, beyond the scope of univariate data, enabling strategic decision-making.
- PESTEL analysis: Looks at how political, economic, social, technological, environmental, and legal factors affect your business, providing a broader understanding of the business environment for strategic planning purposes.
The Value of Univariate Analysis
The power of a univariate analysis lies in its simplicity, making it an accessible tool for businesses of all sizes to gain valuable insights. By focusing on a single variable at a time, your business can gain quick insights into specific aspects of its operations and take targeted action.
Ultimately, univariate analysis could be a game changer for your business, empowering you to identify trends, understand measures of central tendency, and assess the variability of the variables that play a key role in driving your business forward.
Despite its limitations, univariate analysis can be combined with other forms of analysis such as scenario planning, SWOT, and PESTEL to form a more comprehensive understanding of your business. Leverage it to inform strategic decision-making, enhance operational efficiency, and guide overall success.