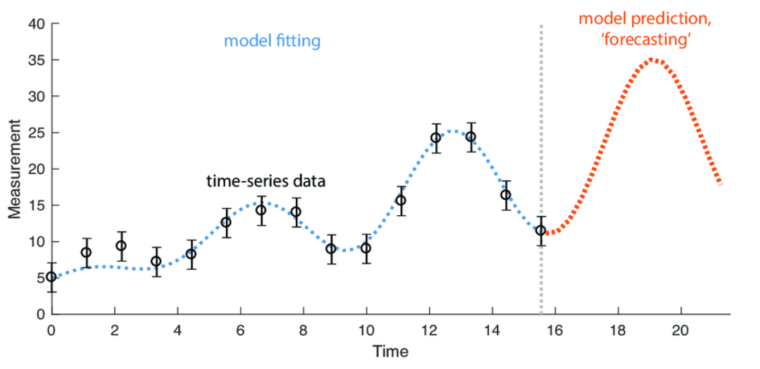
Time series analysis is a valuable technique for uncovering underlying patterns and forecasting future trends from data collected over time. By analyzing time series data at consistent intervals, decision-makers can extract meaningful statistics from raw data, guiding more informed decision-making, resource allocation, and strategic planning.
Whether you’re a trader, investor, or business owner, time series analysis offers a systematic approach to making important decisions under uncertainty. We’ve used our expertise at Business2Community to break down all you need to know to leverage this technique for your strategies. Dive in as we explore a step-by-step process, examples, and more.
Time Series Analysis – Key Takeaways
- Time series is a data analysis technique used to analyze and interpret data collected over a period of time.
- As it tracks data in equally spaced time intervals over a specified period, it surfaces patterns and trends, aiding in strategic decision-making and more accurate predictions.
- While powerful, time series analysis should be used alongside other analytical tools such as scenario planning and PESTEL for more comprehensive and actionable insights.
What is a Time Series Analysis?
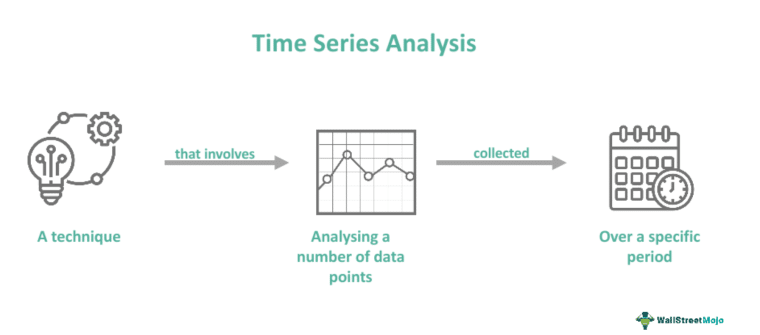
A time series analysis is a statistical technique that studies data points collected at regular intervals over time. It uses various techniques and methods to identify patterns and forecast future values, aiding in data-driven decision-making, strategic planning, and optimal resource allocation.
Who Needs to Do a Time Series Analysis?
Anyone interested in understanding how a variable changes over time and making predictions based on this historical data will benefit from time series analysis. In business contexts, time series analysis is used for a wide range of applications including sales forecasting, financial performance analysis, inventory management, and market research.
Various decision-makers involved in trading, investing, and running businesses rely on its insights to inform their strategies. For example:
- Stock traders and investors use time series analysis to track stock prices and make predictions about future prices or the risks associated with certain stocks.
- Crypto traders use time series analysis techniques to spot patterns, future trends, and shifts in crypto prices.
- Sales managers use time series analysis to identify sales patterns and make forecasts about future sales for budgeting, inventory management, marketing, and resource allocation.
- Business owners use time series analysis to track performance in key business areas. This gives them insights to improve their operations, allocate resources efficiently, and adapt to changing conditions.
- Marketing managers use time series analysis to track KPIs over time. This allows them to measure the effectiveness of their efforts and optimize their strategies accordingly.
How to Perform a Time Series Analysis
Now, let’s dive into a 6-step process for performing a time series analysis:
Step 1: Gather Your Data
When performing a time series analysis, the first step is to gather your data. Time series data is collected by recording data points over consistent intervals. e.g. yearly, monthly, or quarterly as opposed to recording data points intermittently or randomly. As such, you need to ensure your data set has data points recorded at regular intervals.
Step 2: Organize and Explore Your Data
Conduct an exploratory analysis for a preliminary understanding of your data and its characteristics. This typically means representing the key characteristics of your time series data visually through tools such as line charts and histograms.
To describe and summarize the key characteristics of your data set, conduct a descriptive analysis. This involves calculating key descriptive statistics such as the mean and standard deviation.
In addition, consider conducting:
- Trend analysis to check for upward or downward trends in your data.
- Seasonality analysis to identify repeating patterns or cycles at regular intervals.
- Cyclical fluctuation analysis to spot patterns that occur at irregular intervals.
Step 3: Determine Stationarity
Stationarity is the concept that the statistical properties of a time series remain constant over time. Because analyzing time series data that is non-stationary can lead to inaccurate results and unreliable predictions, many time series analysis techniques assume stationarity.
A time series is stationary when it has a constant mean, variance, and autocorrelation/covariance that are independent of time. The presence of trends or seasonality means that a time series is non-stationary.

If a time series is non-stationary, it must undergo transformation or detrending before forecasting models can be applied. To check if your data is stationary, you can use an intuitive approach, which would be a simple visual inspection of your time series plot. You can also use statistical tests such as the Augmented Dickey-Fuller (ADF) Test.
Step 4: Decompose Your Time Series
To reveal underlying patterns within your data and select the right model, you need to break your time series down into its components. Time series data is made up of different components that explain the patterns and behavior of data over time. These include:
- Trends: Increasing or decreasing values in a series or a clear downward and upward trend in the observed data.
- Seasonality: Predictable patterns that recur regularly in the data observed.
- Cycles: Fluctuations that lack a fixed period.
- Noise: Variability in a series that the above components can’t explain.
These components can either be combined additively like this:

Additive models are linear, meaning changes are consistent and the same amount over time.
They can also be combined multiplicatively:

Multiplicative models are nonlinear, meaning changes are seasonal and increase over time.
Step 5: Select a Time Series Analysis Model
There are various statistical models associated with time series analysis. Each method has its own benefits and your choice of technique will depend on your data set and research objectives.
Time Domain Methods:
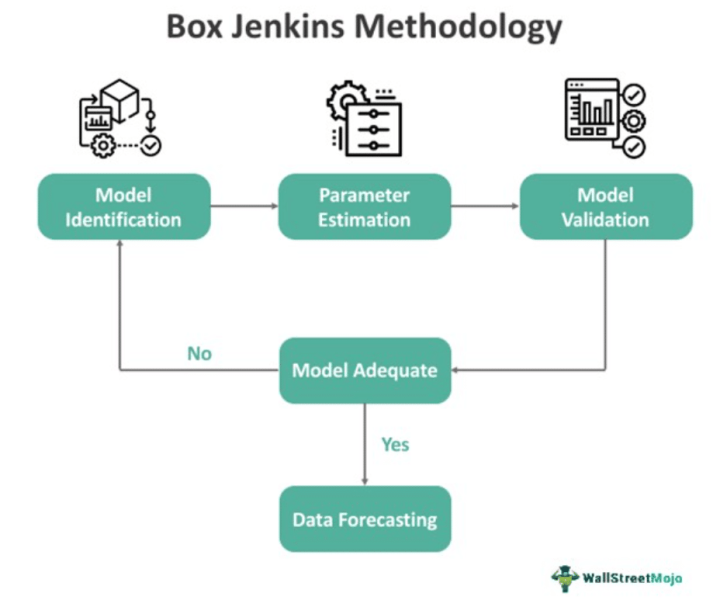
These methods analyze data based on time to identify patterns, trends, and seasonality, e.g. stock market analysis. Common techniques include autoregressive (AR) models, moving average (MA) models, and Box Jenkins multivariate models or autoregressive integrated moving average (ARIMA) models.
Parametric Methods:
These methods analyze time series data by making assumptions about the underlying data structure. This includes ARIMA models, where specific parameters define the autoregressive and moving average components. It also includes techniques such as regression analysis and intervention analysis, which make assumptions about a distribution’s particular structure.
Frequency Domain Methods:
These methods analyze data in terms of frequency instead of time. Common techniques include spectral analysis which breaks down a time series into its frequency components to understand underlying periodic behavior.
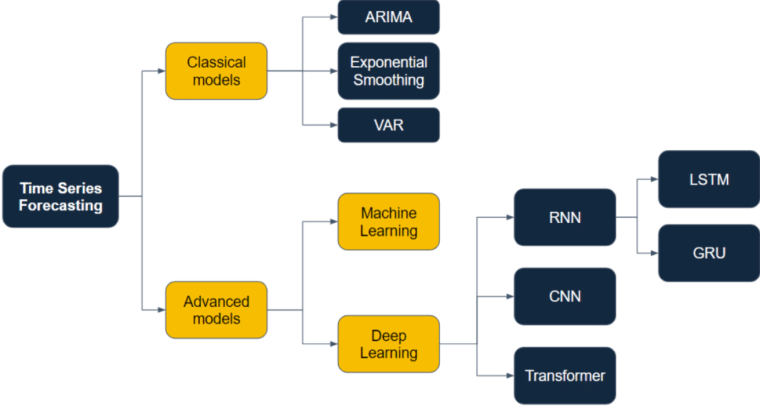
Machine Learning Methods:
Machine learning is a type of AI that enables models to learn almost like how humans learn without being explicitly programmed with the new information. These methods enable more sophisticated and accurate forecasting models. They also help analysts deal with real-world complexities like missing data and sparse datasets. Common techniques include recurrent neural networks (RNN) which use time series data to predict future activity or values.
Time Series Forecasting Methods:
These methods use associated patterns, historical values, or past performance to predict future data points. Time series forecasting methods include moving-average models, autoregressive models, or exponential smoothing.
Once you’ve selected a model, evaluate its performance using metrics like mean squared error (MSE) and run multiple tests to ensure its validity.
Step 6: Make Predictions
Finally, use your model to forecast future values and guide your decision-making. This is done by applying your model to the most recent data points to generate predictions. This might be that you spot a recurring bounce in sales around school holidays and feed that to your marketing team to work to optimize the prediction of another spike, or you could notice that a stock you’re interested in may be volatile month-to-month but long-term is trending upwards so you may choose to invest.
Time Series Analysis Example
Let’s explore a simple example of time series analysis for illustrative purposes. In real-world scenarios, time series analysis is more complex and is generally carried out using advanced statistical software.
Consider a company’s historical stock prices spanning a year.
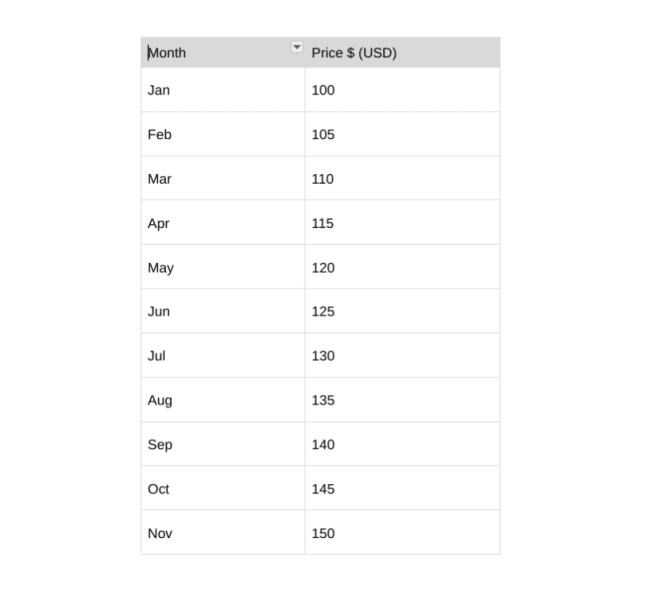
The trader plots the stock prices (in USD) on the Y-axis and months on the X-axis.
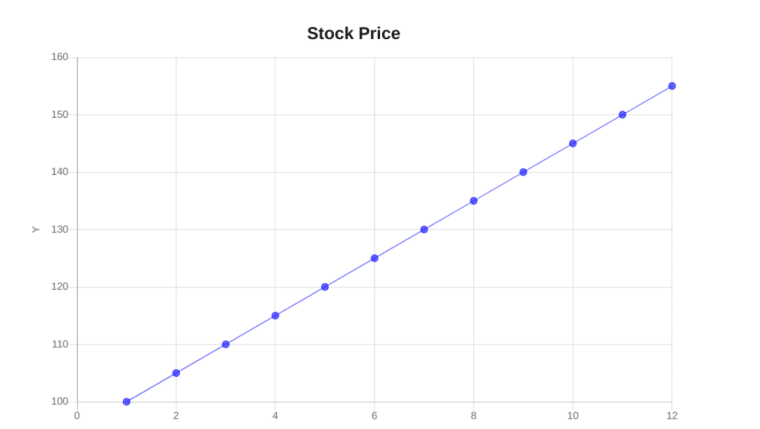
The line graph trends upward, indicating a consistent increase in the stock price. Based on observation and statistical tests, the trader fits a linear regression line to the data. After testing and validation, the stock trader concludes that this model predicts future prices based on the trend observed.
The predicted stock prices for the next year are shown in the table below.
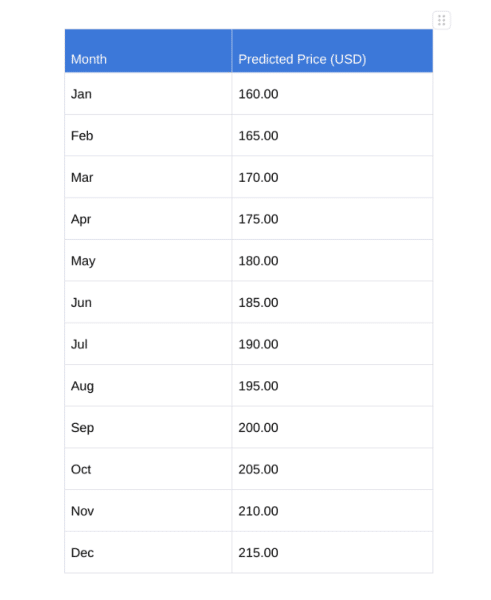
Based on the predictions, the trader decides to invest cautiously, keeping in mind the limitations of the model. While the model suggests that the stock price is increasing, the trader understands that actual market performance might deviate from his simple model.
When to Use Time Series Analysis
Here are two examples of when to use time series analysis:
Understanding How a Variable Changes Over Time
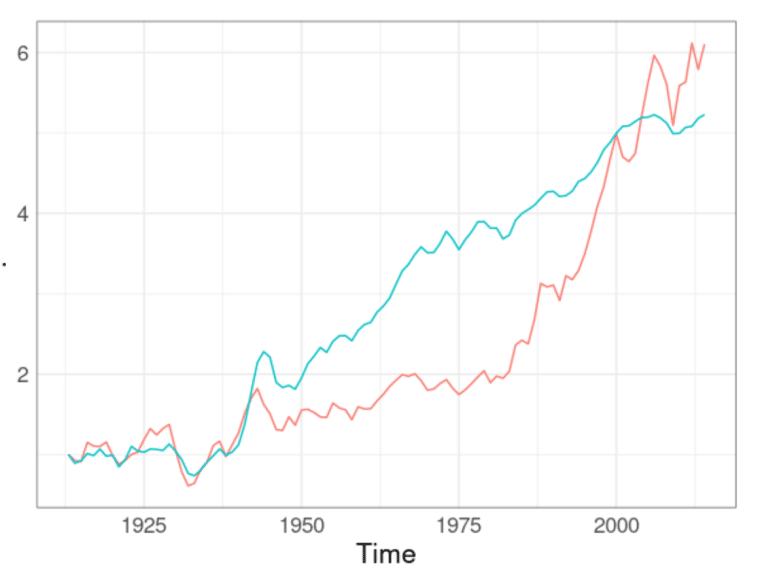
What sets time series data apart from other data is that it shows how variables change over time. It’s particularly valuable for tracking how sales, stocks, and performance metrics evolve. This allows professionals and decision-makers in various fields like data science and business to identify trends, patterns, cycles, or anomalies. This, in turn, helps them make sound, data-driven decisions.
Risk Management
In stock and crypto markets, time series analysis is instrumental in identifying market trends and predicting market behavior. It also plays a crucial role in identifying the risks associated with various factors, such as market fluctuations. This helps investors and traders anticipate potential price movements, manage risks, and capitalize on opportunities.
How to Adjust a Time Series Analysis
To adjust your time series analysis so that it explains historical data accurately and models future behavior reliably:
- Ensure a large data set: Time series analysis often requires many data points for pattern identification and reliable results, so ensure your data spans a considerable period.
- Reduce noise: Noise can obscure underlying patterns and trends. Use filtering techniques to reduce noise in time series data and reveal the most essential information.
- Deal with missing values: Time-series data often contains missing or incomplete values, which can negatively affect the accuracy of analysis and modeling. To deal with missing values, use techniques like interpolation or imputation.
Limitations of Time Series Analysis
Nothing, not even sophisticated analysis techniques like time series analysis, can truly predict the future with perfect accuracy. The technique can certainly be helpful to extrapolate how a certain variable might progress over time but don’t treat the results like prophecy.
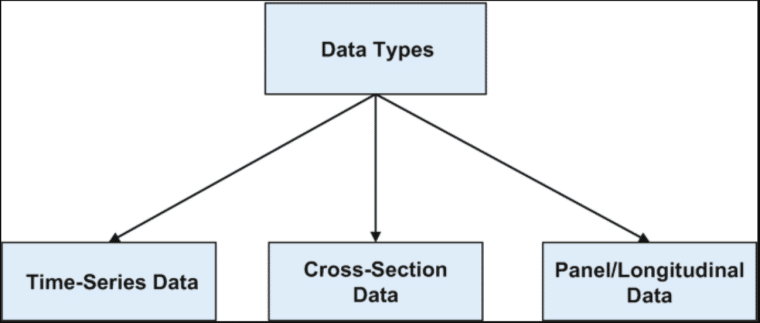
Unlike cross-sectional data that captures a snapshot of multiple variables at a specific point in time, time series analysis studies one variable over an extended time period. While it reveals the underlying structure and pattern of the data, it has limitations.
Dependence on Historical Data
Time series analysis relies on historical data to predict future trends. In dynamic fields like business and economics, past performance might not be a reliable indicator of future results. So, it’s important to supplement your time series analysis with other forms of analysis.
For example, use scenario planning to develop multiple prediction scenarios. This helps account for unforeseen events and provides a range of possible outcomes beyond time series forecasting.
Overlooks External Factors
Time series analysis and forecasting methods rely solely on time series data points. Such data overlooks current external factors that might have a significant impact on outcomes. As such, complement time series analysis with other analysis tools like PESTEL (political, economic, social, technological, environmental, and legal) analysis to gain a more comprehensive understanding of current market conditions.
The Value of Time Series Analysis
In time series analysis, analysts record data points at consistent intervals over a period of time. By analyzing this data, they can understand how certain variables change over time and make predictions about future events.
The value of time series analysis lies in its ability to unlock meaningful statistics to drive strategic decision-making in all kinds of fields and industries. Like most statistical methods, time series analysis has its limitations and is best integrated with other forms of analysis for more comprehensive insights.
Whether you are a trader, investor, or business professional, time series analysis can be a valuable addition to your intelligence efforts. Leverage its power to improve forecasting accuracy, manage risk, and optimize your strategies.

