Startups continue to disrupt industries, changing the way we live and work.
Not only do these fast-paced ventures drive innovation, but they also stimulate employment and boost economic growth. If you’re interested in what makes startups tick, you’re in the right place.
We know that finding startup statistics can be a challenge – facts are scattered across various sources and reports.
That’s why we’ve put together over 100 startup statistics you need to know in 2025. This comprehensive list explores all the latest startup data including success rates, investment trends, and more.
Startup Statistics Highlights
- There are over 75,000 startups in the US alone.
- The success rate for startups is just under 10%.
- 32% of the world’s startups are in the software and data industry.
- Startups across the world received over $445 billion in funding in 2022.
Startup Statistics: What You Should Keep in Mind
- Economic Role: Startups play a crucial role in driving innovation and economic growth, especially in tech-heavy regions like Silicon Valley, New York City, and London.
- Funding Dynamics: With startups receiving over $445 billion in funding in 2022, the investment landscape is robust, though the success rate for startups is critically low at around 10%. The most common reasons include: poor product-market fit (34%), running out of funds (29%), and a weak founding team (23%)
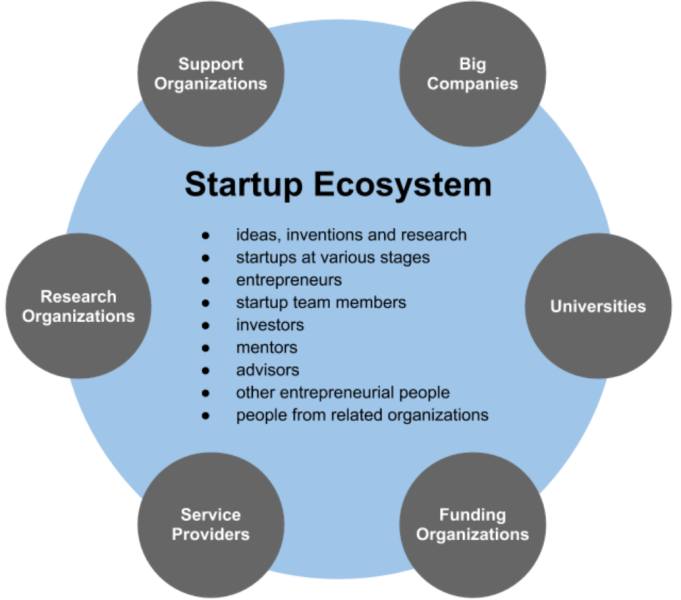
- Ecosystem Importance: The vitality and value of a startup ecosystem, such as those in major hubs, can significantly influence startup success. These ecosystems not only provide essential funding but also critical networking and growth opportunities that can dictate the trajectory of startup success.
The State of Startups Data
The Global Startup Ecosystem Report 2023 (GSER 2023) is a comprehensive analysis of the current state of global startup ecosystems based on data from 3.5 million startups across 290 global ecosystems.
In terms of the top startup ecosystems in the world, the report revealed that:
- Silicon Valley is the best startup ecosystem, accounting for over 31% of the total value of the top 30.
- New York City and London are tied for second place.
- Los Angeles is ranked fourth.
- Tel Aviv is ranked fifth.
These top 5 ecosystems are more mature and have higher funding activity. They also feature a higher number of exits over $50 million.
Collectively, the top 5 startup ecosystems account for an impressive $4 trillion in value.
They also account for 50% of the total value of the world’s top 30 startup ecosystems.
The number of startup exits over $50 million plunged to a mere 7% of 2021 figures in 2023.
Additionally, the deal amount for exits over $1 billion dropped by over 90% in 2022.
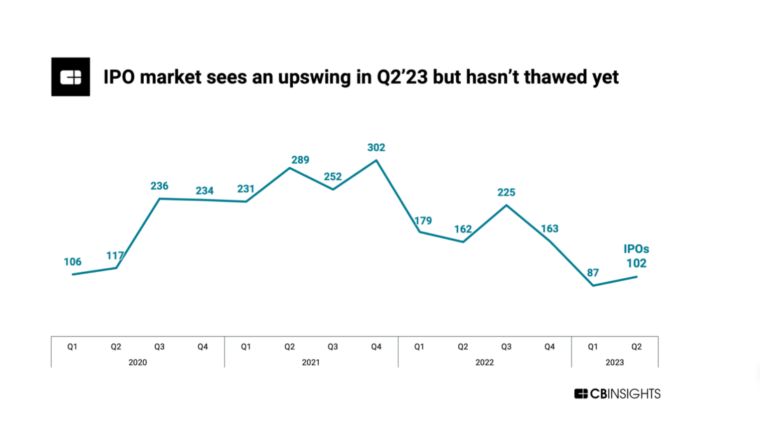
While there was a 31% drop in initial public offerings (IPOs) in 2022, the IPO market showed signs of growth in Q2 2023.
2022 was a bleak year for startups that wanted to go public. The number of global IPOs fell by 31%, to 716. As of Q2 2023, global IPOs increased by 17% to hit 102. The top 2 IPOs by valuation for Q2 2023 went to India-based pharma company Mankind ($6.5 billion) and China-based chipmaker Nexchip Semiconductor ($5.8 billion).
Although unicorn births fell 52% from 539 to 258 between 2021 and 2022, they trended up by 20% in Q2 2023. After hitting a 6-year low in Q1 2023, new unicorn births increased by 20% to hit 18 in Q2 2023.
As of November 2022, 31% of startups had at least one female founder.
Meanwhile, the overall average of female founders across global startup ecosystems was just 15%. Oceania had the highest overall percentage of female founders, at 21.6%. North America was the next highest, with an average of 15.7%. It was only in Brisbane and Manila where over 50% of startups had one or more female founders (72% and 52.6% respectively).
The Middle East and North Africa was the region with the lowest percentage of female founders, at just 10%.
In 2020, 61% of super start-ups across the world offered business-to-business (B2B) solutions. According to Statista, the other 39% offered business-to-consumer (B2C) solutions.
Startup Success Statistics
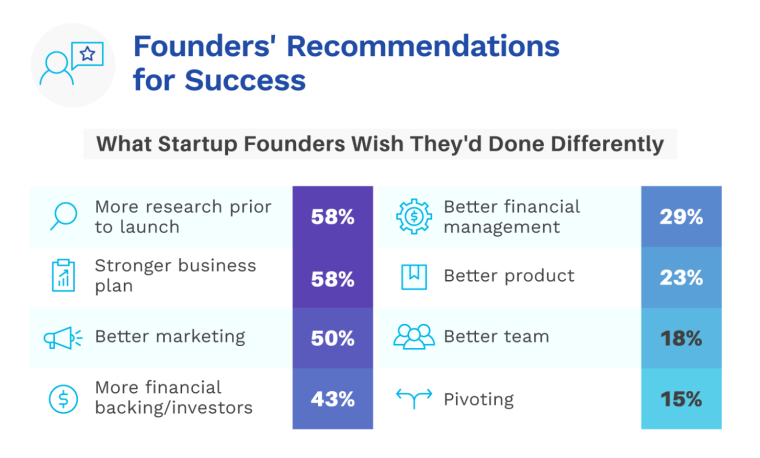
SkyNova surveyed over 500 startup founders in 2022 about what worked, what didn’t, and what they might have done differently in their initial business phases. Key insights gathered include:
- 58% of founders said they would do more research and create a stronger business plan before launching a new business.
- 50% of founders wished they’d done better marketing to reach their target customers.
- 43% of founders would have secured more financial backing or investors.
- 29% would have managed their finances better.
- 23% would have designed a better product.
- 18% would have put together a better team.
- 15% would have pivoted.
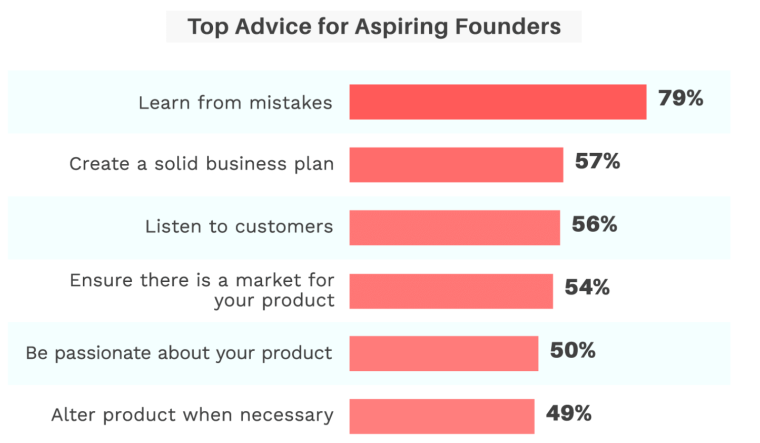
The same survey also found that 79% of founders’ top advice for aspiring founders was to cultivate the skill of learning from their mistakes.
57% of founders stated creating a solid business plan was imperative, while 56% cited listening to customers as their top advice. Other top advice included:
- Ensuring there was a market for your product – 54%
- Being passionate about your product – 50%
- Altering products when necessary – 49%
- Avoiding burnout – 42%
- Setting goals that align with your business vision – 34%
- Focusing on your core product before expanding – 31%
- Getting legal advice – 27%
In 2022, 40% of startup founders had to pivot to avoid failure.
For founders who put time and effort into adjusting their strategies, their pivots were successful 75% of the time. Women tended to show more confidence in their strategies than men, with 39% saying they felt “very confident” that their pivot would be successful. Meanwhile, men most commonly reported feeling only “moderately” so (34%).
Access to funding, resources, and great talent is critical for startup growth, a fact widely recognized by successful founders and supported by Startup Genomes GSER data.
The most successful startups are found in startup ecosystems bearing the following success factors:
- Performance: Exits over $50 million, ecosystem value, and overall startup success.
- Funding: Ease and availability of funding that’s critical to the success of early-stage startups.
- Connectedness: Access to local and global networks.
- Market reach: Early-stage startup access to customers, the ability to scale, and potentially go global.
- Knowledge: Innovation, research efforts, and patent activity.
- Talent and experience: Access to talent and a degree of startup experience.
In addition to the top 5 ecosystems mentioned earlier, Startup Genome has identified the following hotspots or rising ecosystems for startups in 2023:
- Singapore
- Melbourne
- Miami
- Mumbai
- Zurich
Startup Success Factors
According to research by the Harvard Business Review, the average age of founders of high-growth startups is 45.
The top 0.1% of startups were founded by people aged 45. The average and median age of company founders in an earlier Kauffman Foundation study was around 40. While there are many factors that may explain the age advantage in entrepreneurship, work experience is a major one. In fact, founders with at least three years of prior work experience are 85% more likely to launch a highly successful startup.
The probability of startup success increases with age.
Older entrepreneurs have a substantially higher success rate. HBR’s research points to entrepreneurial performance rising sharply with age before cresting in the late fifties. Still, a 60-year-old is 3 times more likely to build a successful startup than a 30-year-old founder.
Research shows that individuals with higher levels of education tend to have greater startup success.
A study by the National Bureau of Economic Research (NBER) found that businesses started by college graduates were more likely to succeed. This echoes earlier studies by the Kauffman Foundation which found that at least 95% of successful tech founders had a bachelor’s degree. A further 47% had advanced degrees.
A venture-capital-backed startup founder whose company goes public has a 30% chance of being successful in their next venture.
First-time founders have an 18% chance of succeeding. On the other hand, startup founders who have previously failed have a 20% chance of succeeding.
Over 50% of Fortune 500 companies started during a recession. Additionally, over 50 unicorns were created in the Great Recession (December 2007 to June 2009) alone.
For certain industries, a crisis creates opportunity. For example, at the start of the pandemic, 12% of startups saw their revenue increase by 10% or more. Plus, key examples of successful startups founded in a recession include:
- Spotify – raised a Series A in 2008
- Twitter – raised a Series A 2007
- Flipkart – raised a Series A in 2009
Historical trends suggest that an economic downturn can be a positive thing for new ventures.
Based on a study of startups spanning over a decade, Startup Genome found that startups funded during the Great Recession had slightly higher exit amounts compared to those funded during economic expansions. VC returns for recession-year startup investments were 13% higher, with startups that achieved Series A funding able to increase the value of their Series A funding twenty-fold by the time of exit.
Startup Failure Statistics
Around 90% of startups completely fail.
Research by Startup Genome further reveals that:
- Only 1.5% of startups and about 15% of those that survive have a successful exit of over $50 million across the top eight US startup ecosystems.
- 70% of startups fail to raise further funding or successfully exit, most failing within 20 months of raising their seed rounds.
According to the US Bureau of Labor Statistics (BLS), up to 20% of startups fail during the first two years.
- Up to 45% fail during the first five years.
- 65% fail during the first 10 years.
- Only 25% of startups survive past the 15-year mark.
Failure rates also vary between startup funding stages:
- 60% of startups fail between the pre-seed and Series A funding stages.
- 35% of Series A startups fail before Series B.
- After Series C, about 1% of startups fail.
CB Insights analyzed over 110 cases of failed startups since 2018 and discovered the top 12 reasons startups failed in 2021:
- Running out of cash or failing to raise capital – 38%
- Not targeting a market need – 35%
- Getting outcompeted – 20%
- Flawed business model – 19%
- Regulatory and legal challenges – 18%
- Pricing or cost issues -15%
- Not having the right team -14%
- Bad product timing – 10%
- Poor product quality – 8%
- Conflict between the team or investors – 7%
- Business model pivots gone bad – 6%
- Lack of passion – 5%
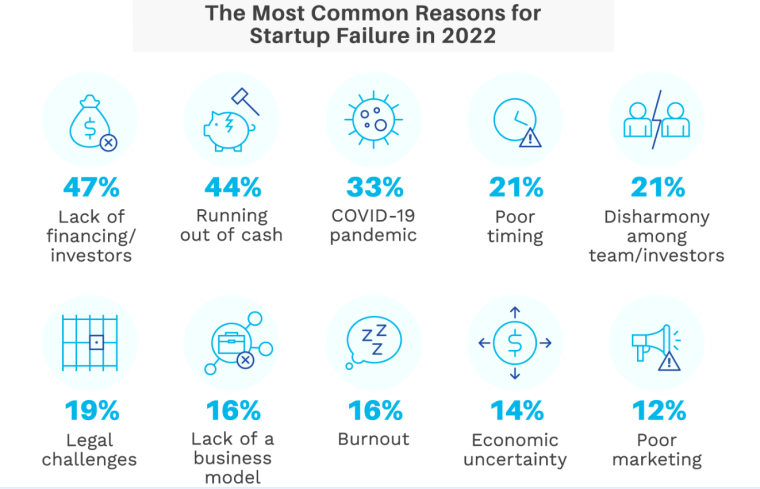
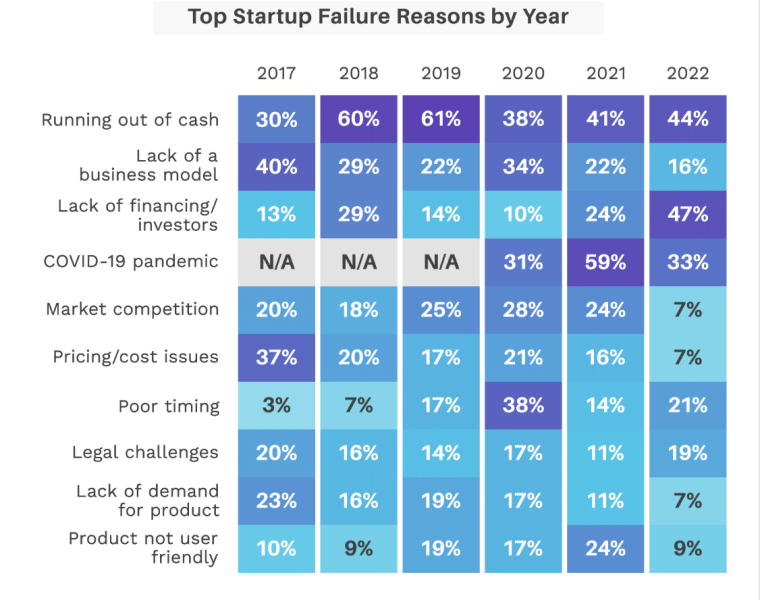
Research by SkyNova revealed that 3.7x more startups failed in 2022 due to a lack of financing/investors than in 2020.
47% of startups in 2022 failed due to a lack of financing or investors. That’s up from 10% in 2020 and 24% in 2021, making cashflow problems the number one reason startups failed in 2022.
The number of startups that failed because they ran out of funds increased from 41% in 2021 to 44% in 2022.
This was also the second most common reason startups failed.
Pandemic Startup Failure Statistics
The COVID-19 pandemic was the third most common reason startups failed in 2022.
COVID-19 accounted for 33% of all startup failures in 2022, down from a high of 59% in 2021.
At the start of the pandemic, 41% of startups had three months or less of cash left to spare.
Around 29% of young startups typically operate with only a few months in cash, however, the pandemic left over 40% of startups with limited cash reserves. Of the startups that had raised Series A, B, or later rounds, 34% had less than 6 months’ worth of cash.
Of the startups that had a term sheet pre-pandemic, 20% had the term sheet pulled by the investor.
A further 53% saw the process slow down significantly or faced an unresponsive lead investor. Only 28% of startups had the process continue normally.
At the beginning of the pandemic, 74% of startups had to terminate full-time employees.
Additionally, 39% of all startups had to lay off 20% or more of their staff and 26% had to let go of 60% of employees or more.
84% of North American startups let go of their employees, putting the region in first place in terms of reducing headcount.
This was followed by Europe with 67% of startups and Asia with 59% of startups reducing headcount during the pandemic.
74% of startups saw their revenues decline at the beginning of the pandemic.
A significant share of startups were heavily hit, with 16% of startups experiencing a revenue decline of more than 80%.
Startup Funding and Investment Data
According to decade-long research conducted by the Kauffman Foundation, the most common types of funding for startups include:
- Banks and other loans – 34.9%
- Personal savings – 30%
- Friends and family – 6.3%
- Credit cards – 6.2%
- Angel investors – 5.8%
- Venture capital – 4.4%
- Government grants and funding – 2%
| Startup Funding Type | Description |
| Bootstrapping | When founders use their personal savings or revenue generated by the business. |
| Seed Funding | The earliest stage of funding from angel investors, friends, family, or venture capital firms. Typically used to validate a product or service concept and to build a team. |
| Angel Investment | Individual investors who provide financial backing for startups in exchange for equity. |
| Venture Capital (VC) | Funds from professional investment firms that invest in early-stage and high-growth startups. |
| Series A Funding | The first significant round of financing from venture capitalists after initial seed funding. Typically used to scale the business and to launch marketing and sales efforts. |
| Series B Funding | The second round of funding for startups that have shown significant progress and growth. Typically used to expand the business and to enter new markets. |
| Series C Funding | The third major round of funding for startups with a proven business model and revenue streams. Typically used to prepare for an IPO or to continue growth. |
| Initial Coin Offerings (ICOs) | A fundraising method where a startup creates a new cryptocurrency token and sells it to investors. Investors own the tokens, which can be used to access the company’s product or service, or they can be traded on cryptocurrency exchanges. |
| Venture Debt Financing | A type of debt financing designed for startups. Typically has a lower interest rate than traditional debt, but it also comes with certain terms and conditions. |
| Crowdfunding | An alternative form of finance that involves collecting small amounts of capital from a large number of people, usually through online platforms. |
| Grants | Non-repayable funds provided by governments, organizations, or foundations for specific purposes. |
| Corporate Funding | Investment and support from established corporations seeking strategic partnerships. |
2019 research by Score found that 78% of startup founders relied on personal savings and employment income to fund their first year of operation.
Of the 22% of founders who sought funding during their first year, the most successful funding sources were loans from friends and family (77% successful) and loans from banks or other financial institutions (58% successful). Only 10% of entrepreneurs received startup funds of more than $25,000.
The same report found that 42% of entrepreneurs relied on bootstrapping, starting out with less than $5,000 in cash reserves.
However, 49% started with more than $10,000 in the bank, while 25% had more than $50,000.
Of the roughly 4 million new businesses registered every year, 0.3% receive venture capital.
In 2022, about $238 billion in VC funding was allocated. This is down from $330 billion in 2021.
Considering factors such as access to funding, the top locations for startups include:
- Silicon Valley
- New York City
- London
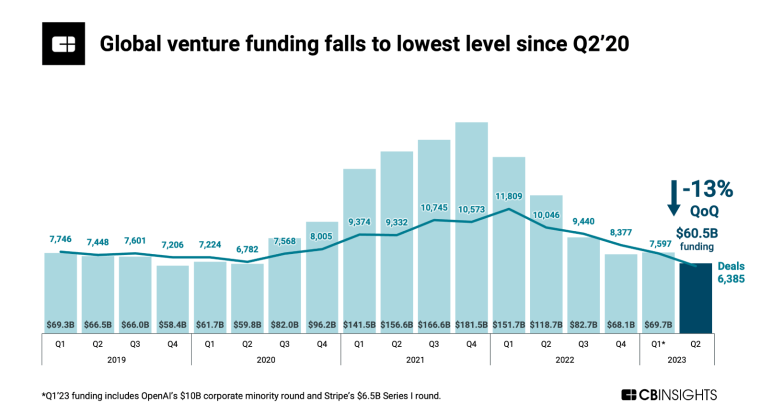
As of June 2023, venture funding amounted to $130.2 billion, less than a third of 2022’s year-end total.
- Global venture funding fell by 13% quarter-over-quarter to $60.5 billion in Q2 2023. This represents a 12-quarter low in funding.
- In Q1 2023, the largest funding rounds went to OpenAI ($10 billion) and Stripe ($6.5 billion).
- Late-stage funding fell in 2022 while early-stage funding remained stable, suggesting that investors had turned their attention to seed funding new startups.
Overall, global startup funding fell 35% from $681 billion to $445 billion between 2021 and 2022. In 2022, there were fewer startups that received funding, but the ones that did received larger amounts.
Between 2021 and 2022, funding deal volume fell by 4% to 36,177 deals. Globally, 6,385 funding deals were closed in Q2 2023, a 16% drop from Q1 2023. Deal count fell for the fifth consecutive quarter to hit 2016 levels.
The average funding deal size in 2022 fell to $16.8 million, which is 32% lower than in 2021. The median deal size slipped as well, falling 14% from $4.3 million in 2021 to $3.7 million in 2022.
Megarounds (those over $100 million) accounted for $190.1 billion of funding in 2022. This represents a 49% drop from 2021. Additionally, the number of global mega-deals fell by 42% to 923 in 2022.
Seed funding totaled $7 billion in Q4 2022, down 35% year over year. Although Q4 2022 seed funding fell to 2020 levels, it was the least impacted funding stage during the 2022 downturn.
There was an 18% decline in the number of early-stage funding deals. However, the average deal size grew by 2% from $4,400 to $4,500 between 2021 and 2022.
In Q4 2022, late-stage funding was $40 billion. That’s down 64% year-over-year with the pullback expected to continue throughout 2023.
Research by the Center for Venture Research revealed the following angel investment insights in 2022:
- Total angel investments in 2022 were $22.3 billion, a decrease of 23.7% from 2021.
- The number of active investors in 2022 increased to 367,945 from 363,460 in 2021, an increase of 1.2%.
- The average angel deal size was $356,650 in 2022, a decrease of 15.4% from 2021.
The top investors for Q4 2022 invested in 309 companies, a decline of 14% quarter-over-quarter and 42% year-over-year.
Plug and Play, SOSV, a16z, and Insight Partners collectively signed deals with 32% fewer companies. The top 3 investors for 2022 were SOSV, Gaingels, and a16z.
| Investor | Investor Group | Companies funded in Q4 2022 |
| SOSV | VC | 42 |
| Gaingels | Angel | 37 |
| Andreessen Horowitz (a16z) | VC | 33 |
| Bpifrance | Other | 32 |
| Accel | VC | 26 |
Startup Stats by Industry
According to a 2023 report by Startupblink, the majority of global startups (31.95%) are in the software and data industry. That’s slightly up from 31.84% in 2022.
The same report found that healthtech had the second-highest number of global startups at 12.83%. This represents a slight increase from 2022 levels.
Fintech startups account for roughly 10.43% of startups worldwide. This is up from around 10.19% in 2022, making fintech the third most popular industry for startup founders.
Research by Startupblink further shows that e-commerce and retail along with social and leisure industries are now less popular choices for startup founders. These two industries experienced the largest drops between 2022 and 2023.
- The share of startups in social and leisure fell from 9.76% to 9.47%.
- The share of startups in e-commerce and retail fell from 10.38% to 9.74%.
| Industry | Share of Startups (2022) | Share of Startups (2023) |
| Software and data | 31.84% | 31.84% |
| Healthtech | 12.74% | 12.83% |
| Fintech | 10.19% | 10.43% |
| Social and leisure | 10.38% | 9.74% |
| E-commerce and retail | 9.76% | 9.47% |
| Hardware and IoT | 6.58% | 6.66% |
| Marketing and sales | 5.12% | 5.15% |
| Edtech | 3.84% | 3.91% |
| Foodtech | 3.56% | 3.67% |
| Energy and environment | 3.37% | 3.47% |
| Transportation | 2.61% | 2.71% |
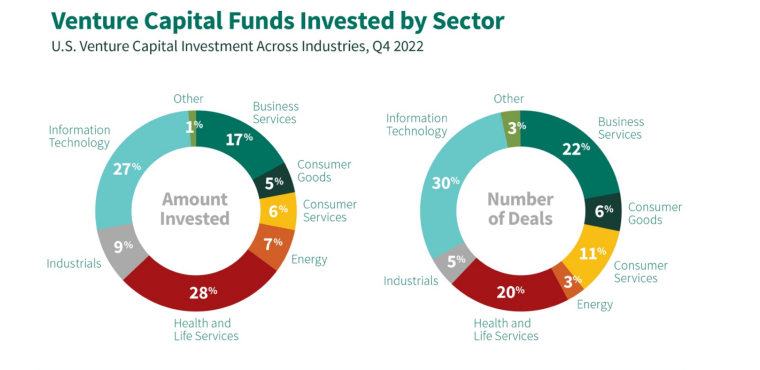
In 2024, AI and big data remain the top VC-funded industries, accounting for 29% of global startup funding. Fintech and life sciences follow closely behind at 16% and 12%, respectively
The fintech and life sciences industries follow, accounting for 16.2% and 10% of total funding respectively. In the US alone, 80% of VC funding in 2022 went to tech and pharma startups.
The highest share of Series A deals (27.9%) were closed by startups in the big data and AI industry. Startups in fintech and life sciences follow, closing 18.9% and 12% of Series A deals, respectively.
| Industry | Global Funding Share (2018-2022) | Global Series A Deal Count (2022) |
| AI and big data | 28.8% | 27.9% |
| Fintech | 16.2% | 18.9% |
| Life sciences | 10% | 12% |
| Manufacturing and robotics | 8.8% | 9.2% |
| Blockchain | 8.6% | 9.6% |
A report by Startup Genome identified advanced manufacturing and robotics, AI and big data, blockchain, and cleantech as key industries in the growth stage.
They show an average 101% increase in Series A deal amount between 2017 and 2022 and an average 788% growth in exit value. Together, these industries account for 62% of reported total startup creation between 2013–2022.
- Blockchain startup deals increased by 57%. The blockchain industry also experienced the highest growth rate in Series A deals (51%). It also experienced the highest growth in exit value at 1,477%.
- Cleantech grew 620% in exit value and 99% in Series A amount between 2017 and 2022. However, Series A deal count increased only modestly (29%) within the same period.
- AI and big data decreased by 25% in overall VC deal count and continued to have the highest overall share of VC deals, at 28%. Additionally, AI and big data experienced the highest growth in exit count (74%) in the period.
The same report found that agtech, cybersecurity, fintech, gaming, life sciences, and the blue economy were in the mature phase. While they continue to grow, their growth isn’t as rapid as industries in the growth phase.
- These industries experienced an average increase of 18% in Series A amounts between 2017 and 2022 and an average growth rate of 196% in exit value. Together, they represent 41% of reported tech startups funded between 2013 and 2022.
- Agtech was the smallest industry, accounting for a 2% share of total funding between 2018 and 2022. However, the industry saw a 64% increase in funding deals in the same time period.
- Digital health experienced the biggest year-over-year drop in funding among sectors, with $25.9 billion raised across 2,122 deals.
- Global fintech startup funding dropped by 46% from $139.8 billion to $75.2 billion in 2022. Additionally, the number of deals closed fell from 5,474 in 2021 to 5,048 in 2022.
- In the gaming industry, VC deals increased by 13% between 2021 and 2022. The industry’s Series A deal amount almost tripled between 2020 to 2021, and Series A deal count increased by 19%. The industry also experienced the highest growth rate in total VC deal count at 13.4% from 2021 to 2022.
Lastly, digital media, edtech, and adtech are in the decline phase as they experienced negative growth between 2017 and 2022.
- The three sectors had an average decrease of 18% in Series A amounts.
- Digital media saw a 40% decrease in Series A count and also experienced a 53% drop in VC deal count between 2021 to 2022.
- Edtech declined 44% in Series A amount but exit value grew 24%.
- Adtech also experienced a 54% decline in total VC deal count and a 23% drop in total deal count.
According to a report by Startupblink, the decline in funding for web3 startups in 2022 was notably higher than in other startup industries. However, investment in 2022 was about $21.5 billion compared to $4.8 billion in 2020.
The same report found that funding for climate tech startups accounted for over 25% of all VC capital investments in 2022. While other sectors are in decline, climate tech continues to receive strong support from governments and private firms.
Research by CB Insights revealed that retail tech funding dropped by 52% in 2022. Total funding fell from $111 billion to $52.9 billion. Additionally, the number of deals dropped from 4,317 to 3,614.
Startups in the gaming industry have the highest success rate, at 50%. In second and third place are edtech and fintech startups, which have success rates of 40% and 25%, respectively.
| Industry | Success Rate | Failure Rate |
| Gaming | 50% | 50% |
| Edtech | 40% | 60% |
| Fintech | 25% | 75% |
| Healthtech | 20% | 80% |
| E-commerce | 20% | 80% |
Global Startup Statistics
Regional Startup Data
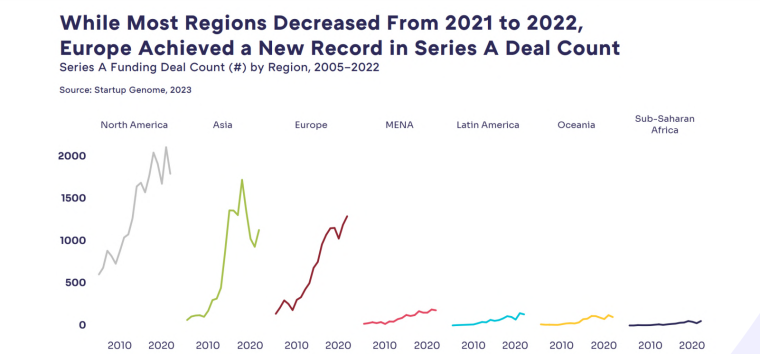
Although North America experienced a decline in overall deal activity in 2022, it is still the world’s leading startup region.
Most notably, Series B+ deal amounts dropped by 41% (from $203 billion to $120 billion) and Series B+ deal count by 24% (from 2,647 deals to 2,006). Early-stage funding dropped by 26% and Series A deal count by 25%.
In 2022, Latin America experienced a 62% drop in total startup funding from 2021. The region also suffered a 54% drop in total deal count and a 72% drop in deal amount for Series B+ funding.
Startup funding in Asia dropped by 31% from $102 billion to $70 billion in 2022.
Asia was the least impacted global region in terms of early-stage funding amount. Early-stage funding dropped just a single percentage point between 2021 and 2022. On the other hand, early-stage funding deal count fell by 4.9% while later-stage funding decreased by 39%.
2022 was the second-biggest year overall for European VC activity after 2021, with deal counts exceeding pre-2021 numbers.
Early-stage funding in Europe declined 15% from 2021, but the average early-stage deal count increased by 7%. The region also experienced a 56% increase in early-stage deal amount in 2022, highlighting the long-term growth in startup investment in the region.
Oceania continues to show positive overall growth in the funding landscape.
The region experienced a 152% increase in Series B+ deal amount, an 81% increase in Series B+ deal count, and a 60.7% increase in early-stage funding between 2018 and 2022. This was the highest of any global region for this period.
In the Sub-Saharan African region, early-stage funding surged by 227% between 2018 and 2022.
Additionally, early-stage deal count increased by 43.8% from 2018 to 2022, highlighting the rapid development of the region’s startup scene. Startups in the region raised $991 million in Q4 2022 and $3,1 billion in 2022. This represents a 164% quarter-over-quarter increase and a 35% year-over-year improvement. Overall, this is a new record for the region. South Africa drove 32% of the continent’s funding, followed by Kenya (18%) and Nigeria (17%).
Between 2018 and 2022, the MENA region saw a 96% jump in early-stage funding amount. It also experienced a 28% growth in Series B+ deal count and an impressive 113% increase in Series B+ deal amount.
US Startup Statistics
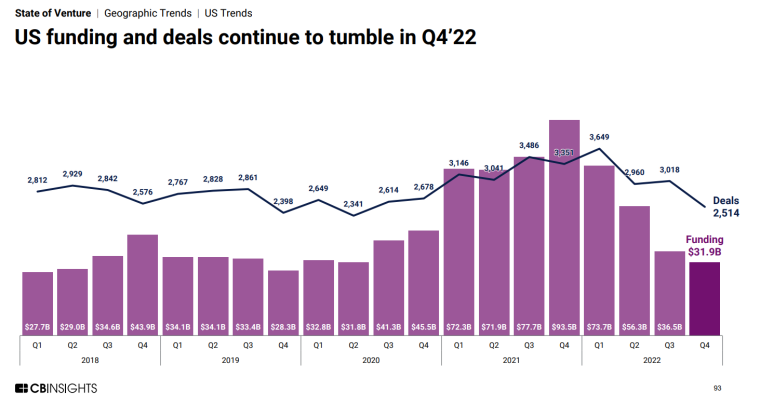
Funding activity in the US fell to $31.3 billion in Q2 2023. This represents a 27% decline quarter-over-quarter and its lowest level in over 3 years.
Deal activity in the US has also slowed down. falling by 13% between Q1 2023 and Q2 2023. In the first two quarters of 2023, US deals fell to 2,320. Despite the funding drop, US-based startups accounted for over half (52%) of global funding raised in Q2 2023.
US startup funding deals decreased from 13,024 to 12,141 between 2021 and 2022.
Of these deals, early-stage deals dominated, with a share of 57%. The rest of the share of deals was distributed as follows:
- Mid stage – 12%
- Late stage – 8%
- Other – 23%
A total of $198.4 billion was invested in US startups in 2022. This represents a 37% drop from $315.3 billion in 2021.
Top equity deals in Q4 2022 included:
- Anduril – $1.5 billion
- Form Energy- $450 million
- NetSPI – $410 million
- Arctic Wolf Networks – $401 million
- Skydance Media – $400 million
All exit types in the US slowed down in 2022. IPOs in the US saw the sharpest drop at 72% year over year.
Top US investors for Q4 2022 were:
- SOSV
- Gaingels
- Andreessen Horowitz
- Accel
The US ranks 4th in the Global Talent Competitiveness Index 2022.
Access to the right talent is crucial to startup success. As the US is in the top five of the index, it is considered a lucrative talent pool for startups.
Early startup job creation in the US was 4.7 jobs per capita in 2021. Although startup job creation is down from pre-pandemic levels, startups in the US created 4.7 jobs for every 1,000 people.
The survival rate for early US startups was 81.7% in 2021. This represents a slight increase from 2020 levels due to improving economic conditions.
UK Startup Statistics
The failure rate for startups in the UK is around 60%.
While startup failure rates may be high, the UK remains a promising location for entrepreneurs and investors alike. The UK offers a strong environment for scaling up, with a supportive business culture and access to capital.
The UK ranks 10th in the Global Talent Competitiveness Index 2022.
Attracting the right talent is crucial to startup success. As the UK is in the top ten of the index, it is considered a favorable talent pool for startups.
The UK has the highest exit rate in Europe, with an average of 7.3 exits per 100,000 people. Boasting a healthy exit market, many successful startups have been acquired by larger companies or have gone public in the UK.
London is Europe’s leading tech startup ecosystem.
It has experienced a surge in high-value exits over $1 billion. This includes the fintech Wise ($12.2 billion), Deliveroo ($10.5 billion), and Oxford Nanopore Technologies ($4.6 billion). In addition, Europe’s largest Fintech unicorn, Revolut, is based in London, boasting a valuation of $33 billion.
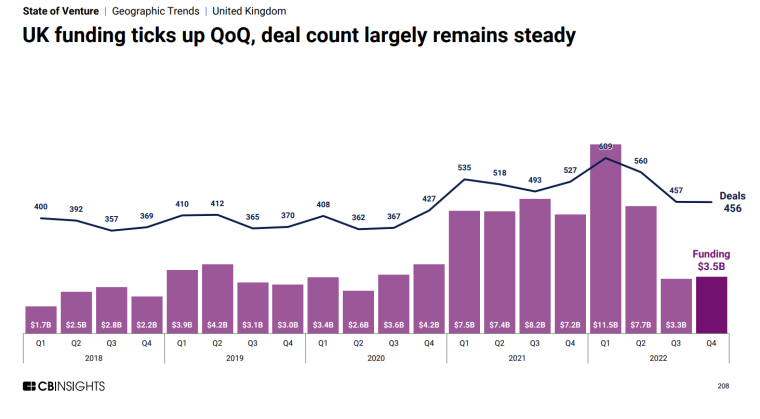
UK startup funding deals increased from 2,073 to 2,082 between 2021 and 2022.
Of these deals, early-stage deals dominated with a share of 69%. The rest of the share of deals was distributed as follows:
- Mid stage – 9%
- Late stage – 11%
- Other – 11%
A total of $26 billion was invested in UK startups in 2022. This represents a 15% decline from $30.3 billion in 2021.
Top equity deals in the UK in Q4 2022 included:
- Snyk – $196 million
- Zappi – $170 million
- Allica Bank – $123 million
- Improbable – $112 million
- Stability AI – $101 milliom
Canada Startup Statistics
Canada ranks 15th in the Global Talent Competitiveness Index 2022.
The right talent is a startup success factor. As Canada is in the top 20 of the index, it is considered a favorable talent pool for startups.
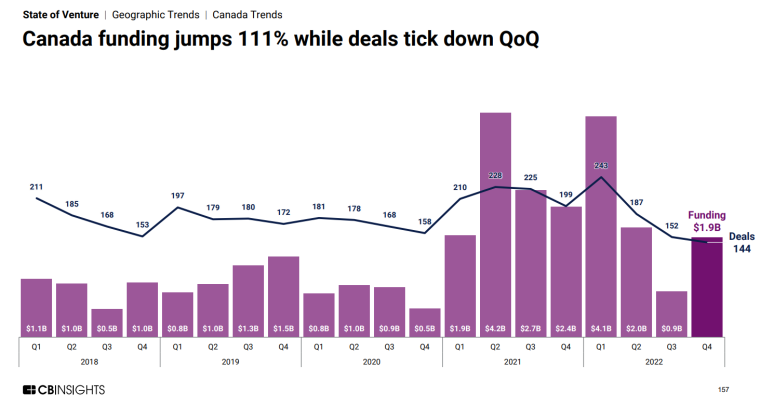
Canada startup funding deals increased from 862 to 726 between 2021 and 2022.
Of these deals, early-deals dominated with a share of 68%. The rest of the share of deals was distributed as follows:
- Mid stage – 9%
- Late stage – 9%
- Other – 14%
A total of $8.9 billion was invested into Canadian startups in 2022. This represents a 21% drop from $11.3 billion in 2021.
Top equity deals in Canada in Q4 2022 included:
- Svante – $318 million
- TouchBistro – $110 million
- Xanadu – $100 million
- Hopper – $96 million
- Alpha-9 Theranostics – $75 million
The top Canadian investors for Q4 2022 were:
- BDC Capital
- Mistral Venture Partners
- Evok Innovations
- Radical Ventures
Germany Startup Statistics
Germany ranks 14th in the Global Talent Competitiveness Index 2022.
Access to the right talent plays a major role in startup success. As Germany is in the top 20 of the index, it is considered a favorable talent pool for startups.
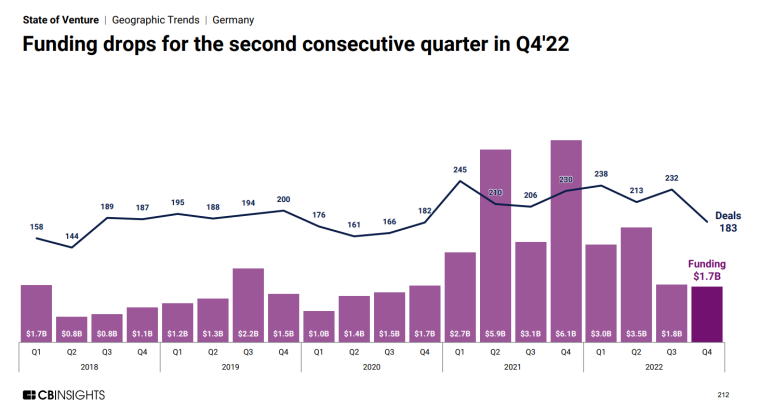
German startup funding deals decreased from 891 to 866 between 2021 and 2022.
Of these deals, early-stage deals dominated with a share of 73%. The rest of the share of deals was distributed as follows:
- Mid stage – 10%
- Late stage – 12%
- Other – 5%
A total of $10 billion was invested into German startups in 2022. This represents a 44% drop from $17.8 billion in 2021.
Top startup deals in |Germany in Q4 2022 included:
- Matter Labs – $209 million
- Volocopter – $182 million
- Razor – $74 million
- Holidu – $73 million
- Resolve Biosciences – $71 million
India Startup Statistics
As of 2023, India has a workforce of over 1.4 billion. India’s high working-age population has created the world’s largest talent pool.
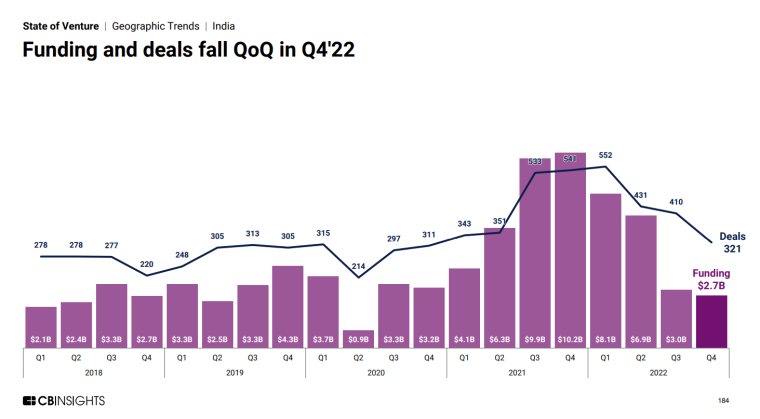
Startup funding deals in India decreased from 1,768 to 1,714 between 2021 and 2022.
Of these deals, early-stage deals dominated with a share of 74%. The rest of the share of deals was distributed as follows:
- Mid stage – 10%
- Late stage – 12%
- Other – 5%
A total of $20.7 billion was invested in Indian startups in 2022. This represents a 32% drop from $30.5 billion in 2021.
Top equity deals in India in Q4 2022 included:
- Table – $300 million
- BYJU’s – $250 million
- HealthKart – $135 million
- Amagi – $82 million
- KrazyBee – $101 million
In 2022, the number of unicorns was down 33% to 24, and exits declined to $5.5 billion. India minted a record 36 unicorns in 2021 and raised a total of $72 billion in exits during the same period.
Number of Startups by Country
Startup efforts are widespread across the globe, but the US leads with over 75,721 startups as of August 2023.
- In second place is India with 15,686 startups.
- The UK follows with 6,906 startups.
- Canada ranks fourth with a total of 3,748 startups.
| Country | Estimated Number of Startups |
| United States | 75,721 |
| India | 15,686 |
| United Kingdom | 6,906 |
| Canada | 3,748 |
| Australia | 2,700 |
| Indonesia | 2,500 |
| Germany | 2.409 |
| France | 1.620 |
| Spain | 1,464 |
| Brazil | 1,177 |
What are the Biggest Startups?
As of July 2023, there were over 1,200 unicorns around the world. This is up from 590 unicorns in 2021.
A unicorn startup is a private company with a valuation of over $1 billion. Variants include a decacorn, valued at over $10 billion, and a hectocorn, valued at over $100 billion. Unicorns are critical success stories that increase capital flow to ecosystems. They also boost the reputation of an ecosystem, attracting more entrepreneurs and investors.
North America accounted for 50% of new unicorns in Q2 2023.
This was followed by Asia with 28%. The top 2 new unicorns by valuation for the quarter were China-based tea brand ChaBaiDao ($2.5 billion) and US-based cloud compute provider CoreWeave ($2.2 billion).
China and the United States are home to the highest number of unicorns worldwide.
In addition, both countries are home to the highest-valued unicorns. The US is the only country that has spawned tech companies reaching a combined valuation of $1 trillion over the last 3 decades – Google, Amazon, Tesla, and Facebook.
The odds of a startup becoming a unicorn are about 1%. Popular former unicorns include Airbnb, Facebook, and Google.
As of April 2023, ByteDance was the highest-valued unicorn globally. The Chinese tech company owns TikTok and is valued at about $200 billion.
| Company | Valuation in Billions | Country | Industry | Year Founded | Total Investment Received in Billions |
| ByteDance | $225 | China | Media and entertainment | 2012 | $7.44 |
| SpaceX | $137 | United States | Industrials | 2002 | $9.70 |
| SHEIN | $66 | Singapore | Consumer and retail | 2012 | $3.65 |
| Stripe | $50 | United States | Financial services | 2010 | $9.40 |
| Canva | $40 | Australia | Enterprise tech | 2013 | $0.57 |
| Revolut | $33 | United Kingdom | Financial services | 2015 | $1.72 |
| Epic Games | $31.5 | United States | Media and entertainment | 1991 | $6.37 |
| Databricks | $31 | United States | Enterprise tech | 2013 | $3.49 |
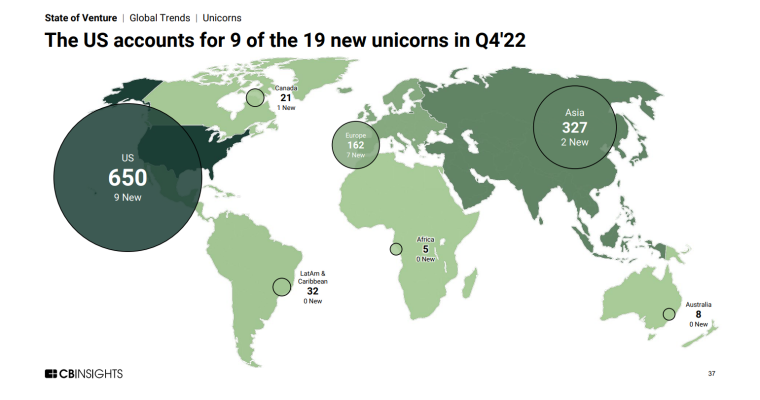
The top unicorn births in Q4 2022 were:
- Astera Labs – $3.2 billion
- Nutrabolt – $2.8 billion
- Jetti Resources – $2.5 billion
- BeZero – $2.0 billion
- Uniswap – $1.7 billion
In 2022, the industry with the most unicorns was software and data, accounting for 39.4% of all unicorns.
Fintech placed second with 20.6% of all unicorns. In third place was the e-commerce and retail industry, which had 12.1% of all unicorns.
Wrapping Up: Start-Up Statistics are Impressive
Startups continue to be vital drivers of innovation and economic dynamism.
Despite high failure rates, the successful ones significantly influence technological advancement and industry transformation. As funding continues to flow, particularly in leading hubs, startups are poised to remain at the forefront of economic and technological evolution.
FAQs
How many startups are there in the US?
How many tech startups are founded every year?
What percentage of startups are successful?
What percentage of startups are profitable?
What percentage of US startups fail?
References
- Startup Genome GSER 2023
- CB Insights State of Venture 2022
- Startup Genome
- Statista
- SkyNova
- Harvard Business Review
- Kellogg Insight
- NBER
- Kauffman
- Startup Genome
- BLS
- SPDload
- Startup Genome
- PR Newswire
- Olin Brookings Commission
- CB Insights SOV 2023
- Crunchbase
- Paul College
- Startupblink
- Statista
- Insead
- Business Insolvency Helpline
- Startupranking
- CB Insights
- Statista
