Social media has become an integral part of our lives, influencing the way we connect, communicate, and consume information. With over 50% of the world on major social networks, leveraging social media’s reach is no longer an option but a necessity for businesses looking to remain competitive.
Navigating the vast sea of social media statistics can be overwhelming – information is spread across numerous reports and it can be challenging to find comprehensive, up-to-date data. This is why we’ve done the legwork and compiled over 100 social media statistics. Whether you’re looking to harness the power of social media or simply curious about its impact, you’re in the right place. Read on to discover the trends and patterns shaping the social media landscape in 2025.
Social Media Statistics Highlights

Social Media Industry Statistics
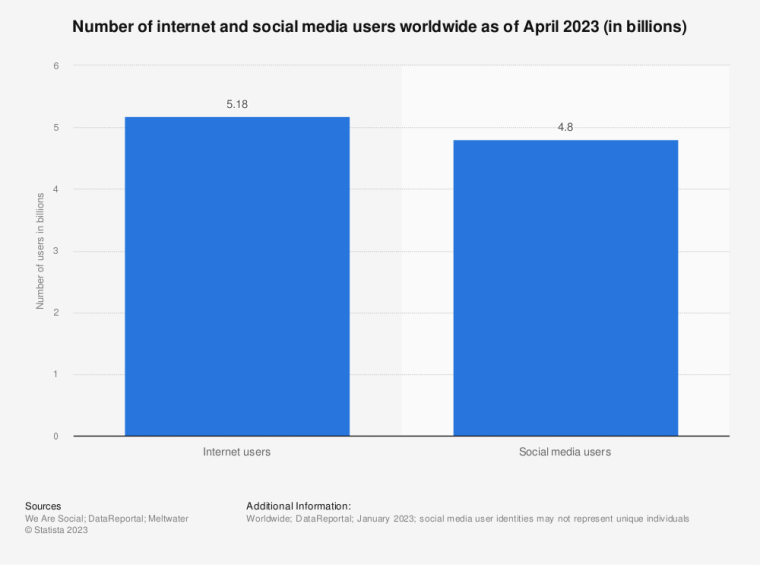
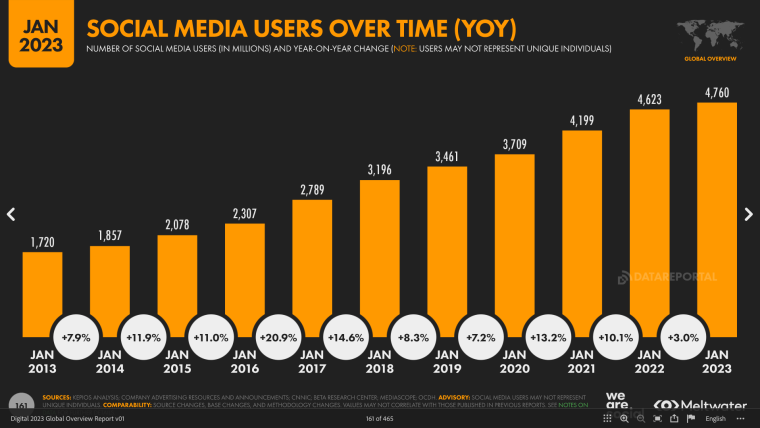
As of April 2023, there were 4.8 billion active social media users.
According to Data Reportal, active social media users increased by 3% or 150 million year-on-year, which was an average rate of 4.7 new users every second.
As of April 2023, 92% of all internet users were on social media, compared to 84% in 2020.
Out of 5.18 billion total internet users, 4.8 billion were on social media. This is compared to 3.8 billion social media users out of 4.54 billion total internet users in 2020.
Year
Social Media Users in billions
Year-on-year growth
2018
3.2
15%
2019
3.5
8%
2020
3.7
7%
2021
4.2
13%
2022
4.6
10%
2023
4.8
3%
The global social media market grew from 193.52 billion in 2022 to 231.1 billion in 2023.
This represents a compound annual growth rate (CAGR) of 19.4%, impacted primarily by the Russia-Ukraine war and the COVID-19 pandemic.
The social media market is expected to grow to $434.87 billion in 2027 at a CAGR of 17.1%
The growth of the social media market will be driven by an increase in both internet use and the widespread availability of internet-accessible devices such as smartphones and tablets.
As of January 2023, 94% of all internet users visited or used social networks.
Right behind chat and messaging websites and apps, social networks are the top type of digital property visited on the internet.
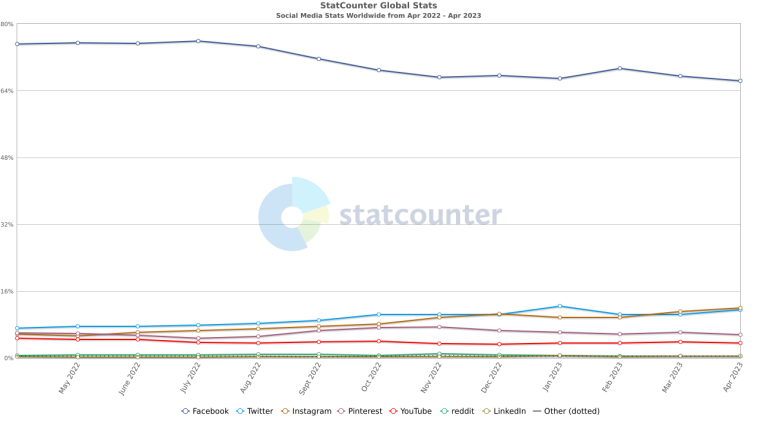
Meta’s Facebook and Instagram have over 78% of global social media web traffic share.
As of April 2023, Facebook had 66.31% and Instagram had 11.94% of the global social media web traffic share. Other social networks:
- Twitter – 11.49%
- Pinterest – 5.54%
- YouTube – 3.49%
- Reddit – 0.46%
Between February and April 2023, Facebook.com had 50.62 billion visits, making it the most popular social platform in the world.
With 19.06 billion visits in the same period, Twitter is the second most popular platform. In third place is Instagram with 18.55 billion total visits.
Meta owns four of the largest social media platforms, each boasting over one billion monthly active users (MAUs).
The four platforms are Facebook, WhatsApp, Facebook Messenger, and Instagram.
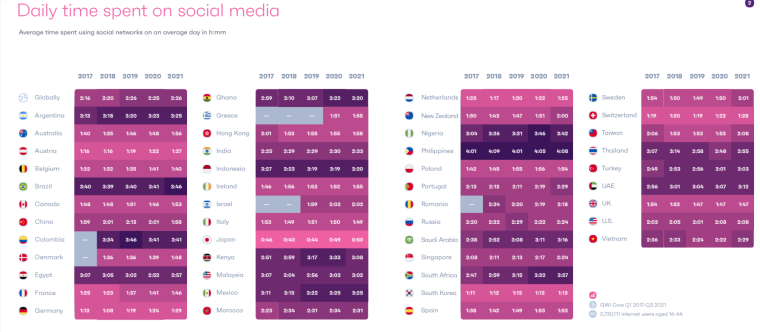
As of January 2023, internet users aged 16-64 spent an average of 2 hours and 24 minutes using social media, daily.
This is down 5 minutes from 2022 but close to an hour jump from time spent in 2013. Assuming a person gets 8 hours of sleep, social media users are spending over 15% of their waking hours on social media.
TikTok had the highest total monthly time spent per user over the course of 2022.
Android app users spent an average of almost 24 hours per month on the TikTok app between January and December 2022, slightly ahead of YouTube’s 23 hours per month. Facebook and WhatsApp occupied positions three and four with 20 and 17 hours per month, respectively.
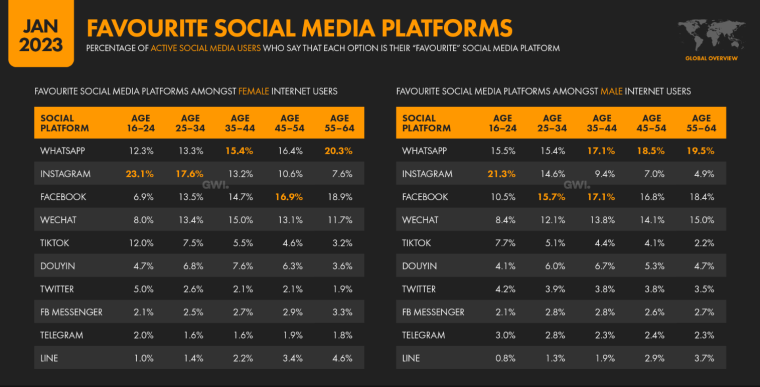
As of January 2023, WhatsApp was the world’s favorite social media platform.
According to research by GWI, over 15.8% of active social media users aged 16 to 64 rated WhatsApp as their favorite platform. Instagram and Facebook came second and third as ranked by 14.3% and 14.2% of active social media users, respectively.
Less than 1% of active social media users on any given platform are unique to that platform.
A small percentage of social media users use only one social media platform. For example, among worldwide users aged 16 to 64:
- 1.2% are unique to YouTube
- 0.7% are unique to WhatsApp
- 0.6% are unique to Facebook
- 0.2% are unique to Instagram
- 0.2% are unique to Twitter
- 0.2% are unique to LinkedIn
- 0.1% are unique to TikTok
The average number of social platforms used by a social media user each month was 7 in January 2023.
The average internet user visited 7.2 social media platforms each month in 2022. This is down 4.6% year-over-year.
Social media engagement has leveled off globally.
Since reaching peak levels of engagement in 2020, social media engagement rates have slowed and leveled off. In fact, there has been a 12% rise in people saying they use social media less than they used to.
Despite security concerns, social buying has made significant progress.
Facebook Marketplace and Instagram Shopping have increased by 8% since 2020. According to GWI, internet users, particularly in North America, are more likely to log onto platforms with commercial activities in mind. According to Meltwater, social buying is expected to account for 16.7% of all e-commerce sales by 2025.
Short-form video is still the most popular form of content consumed on social media, but long-form is gaining traction with Gen Z.
Outside China, 61% of social media users view or create a story on Snapchat, Instagram, or Facebook at least monthly. Research by GWI reveals that while Gen Zs lead the pack in terms of short-form videos, they are just as likely to watch long-form videos.
The most popular types of social media accounts followed as of January 2023 were friends and family.
44.9% of social media users followed friends, family, or people they know. The second most followed accounts included actors, comedians, or other performers.
Social media has emerged as a key source of news in 2023.
Over 30% of social media users across all ages and genders say reading news stories is their main reason for using social media.
Over 50% of companies in April 2023 use at least one social media platform for marketing.
Outside of China, Facebook remains the key social network for marketing, with 22% of professionals stating they use the platform for marketing activities. In second place is Instagram (18.2%) and in third place is WhatsApp (16.6%).
Social Media Platform Statistics
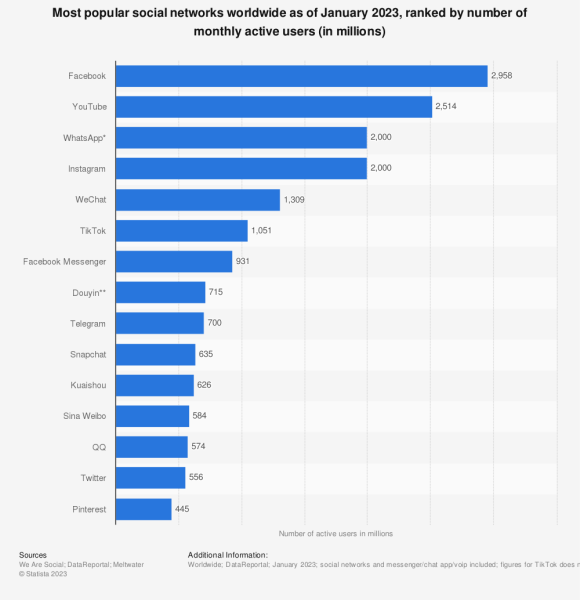
Some of the most popular social media platforms as of April 2023 include:
- Facebook – 2.9 billion MAUs
- Youtube – 2.5 billion MAUs
- WhatsApp – 2 billion MAUs
- Instagram – 2 billion MAUs
- TikTok – 1 billion MAUs
Whether it’s sharing personal moments, promoting brands, engaging in discussions, or discovering new trends, social media platforms continue to shape the way we engage with the world around us. Each popular social media platform offers its own unique features which will be discussed in detail below.
Facebook Data
Founded in 2004, Facebook is owned by Meta Platforms, the 8th most valuable company by market cap in 2023. Facebook allows users to
- Create profiles.
- Connect with friends and family.
- Share updates, photos, and videos.
- Join groups.
- Follow pages of interest.
Facebook also offers various social advertising formats and targeting options for businesses to promote their products or services.
Demographics
Facebook had almost three billion monthly active users as of January 2023, with the highest number of users (314 million) in India. Other notable user bases include the US, Indonesia, and Brazil which had over 100 million users. More men use Facebook, with over 20% of global Facebook users belonging to the 25 to 34 age group.
Content and engagement
Content on Facebook can be shared in the form of images, videos, reels, and stories. The engagement rate across all posts between December 2022 and February 2023 was 0.07%. Photo and Status posts saw the most engagement, at 0.13% and 0.09%, respectively.
As of April 2023:
- 70.6% of active social media users were on Facebook to message friends and family.
- 63.6% of social media users were on Facebook to post or share photos or videos
- 59.1% of social media users were on Facebook to keep up-to-date with news and current events.
- Android app users spent an average of 18 hours and 17 minutes per month on Facebook with over 62% opening the app every day.
- 15.8% of internet users aged 16 to 64 said Facebook was their favorite platform.
Web Traffic
Facebook had 50.62 billion visits between February and April 2023 and an average of 16.8 billion monthly visitors. The average time per visit was 10 minutes and 24 seconds and on average, users visited 8 pages.
Revenue
Facebook generates its revenue primarily through advertising. In 2022, Facebook’s ad revenues were $135.9 billion. Insider intelligence estimates that 58.5% of Meta’s revenue will be generated by Facebook in 2023.
Instagram Data
Instagram is a photo and video-sharing app acquired by Meta Platforms in 2012. It allows users to:
- Share photos and videos.
- Follow other users.
- Explore content through hashtags.
- Engage with posts through likes, comments, and direct messages.
- Shop in-app.
Instagram also offers various social advertising formats and targeting options for businesses to promote their products or services.
Demographics
As of January 2023, Instagram had over two billion monthly active users, with the largest user bases being in India (330 million) and the US (143 million). Instagram’s users were predominantly male, and 60% of worldwide users were between 18 and 34 years old.
Content and engagement
Content on Instagram can be shared in the form of images, videos, reels, and stories. In June 2022, images had an average reach of 1,850 users. Carousels, which are posts containing multiple photos or videos, had an average reach of 2,325 users, making them the leading type of content on Instagram throughout 2021 and 2022.
As of April 2023:
- 69.8% of active social media users were on Instagram to post or share photos or videos.
- 61.8% of social media users were on Instagram to look for funny or entertaining content.
- 61.7% of active social media users were on Instagram to follow or research brands and products.
- Android app users spent an average of 12 hours and 30 minutes per month on Instagram with over 58.5% opening the app every day.
- 14.3% of internet users aged 16 to 64 said Instagram was their favorite platform.
Web Traffic
Instagram had 18.5 billion visits between February and April 2023 and an average of 1.04 million unique monthly visitors. The average time per visit was 7 minutes and 46 seconds and users visited 11 pages.
Revenue
Instagram generated $43.2 billion in revenue in 2022, which is up from $42.1 billion in 2021. Insider Intelligence projects that up to 41.5% of Meta’s revenue will come from Instagram in 2023 and that its ad revenues will grow faster than Facebook’s.
TikTok Data
TikTok is a social media platform for creating and sharing short videos. The viral platform is owned by Bytedance and was launched in 2016. TikTok allows users to:
- Create and share short-form videos of varying lengths.
- Add filters, effects, music, and various editing features to videos.
- Follow other accounts, like videos, leave comments, and engage with the TikTok community through duets and collaborations.
- Enjoy personalized content recommendations based on their preferences and interactions.
- Shop in-app.
TikTok also offers various ad formats and targeting options for businesses to promote their products or services.
Demographics
Since 2020, monthly TikTok use among internet users has increased by 40%. As of January 2023, the platform had 1.05 billion monthly active users. A majority of these users (132 million) were based in the US, followed by Indonesia with 110 million users. 53.4% of TikTok’s global users are female and 46.6% are male.
Users aged 18 to 24 are the largest age group, accounting for 43.7% of the platform’s user base. TikTok’s second largest age group is 25 to 34. The platform remains popular among Millennial and Gen Z users. However, research conducted by GWI shows that TikTok has cross-generational appeal in 2023, with older users flocking to the platform to enjoy short-form videos.
Web Traffic
TikTok had a total of 5.7 billion visits between February and April 2023 and an average of 1.9 billion monthly visitors. The average time spent on TikTok was 3 minutes and 29 seconds and the number of pages visited was around 7.
Content and Engagement
TikTok’s popularity stems from short-form videos. In June 2022, a survey of global marketers revealed that short-form videos had not only high engagement among online users but also the best return on investment (ROI).
As of April 2023:
- 79.8% of active social media users were on TikTok to look for funny or entertaining content.
- 38.2% of social media users were on TikTok to research brands and products.
- 36.5% of social media users used TikTok to post or share photos and videos.
- Android app users spent an average of 31 hours and 32 minutes per month on TikTok with over 60.5% opening the app every day.
- 6.1% of internet users aged 16 to 64 said TikTok was their favorite platform.
Revenue
TikTok generates its revenue primarily through advertising and in 2022, the company’s annual ad revenue increased by 155% to hit $9.4 billion. In Q1 2023, TikTok generated almost $500 million in revenue, down by around 1% compared to Q1 2022.
Twitter Data
Founded in 2006 and acquired by Elon Musk in 2022, Twitter is a social media platform centered around short messages known as Tweets. Over the years, the platform has evolved into a dynamic platform for sharing thoughts and staying updated on a wide variety of topics. Twitter allows users to:
- Tweet and Retweet.
- Follow other accounts and create curated lists of accounts.
- Like and reply to Tweets.
- Engage in conversations.
- Mention and tag other users in their tweets.
- Use hashtags to categorize and explore related content.
- Send private messages to other users.
- Share images, videos, GIFs, or links to their tweets.
- Explore trending topics or popular hashtags and discussions.
Demographics
As of April 2023, Twitter had over 556 million monthly active users with a majority of users (64.9 million) in the US and Japan (51.8 million). Twitter is used mostly by users aged 25 to 34, with this age group accounting for over 38.5% of the social platform’s worldwide user base in 2022. Additionally, men account for 64.3% of Twitter’s audience.
Content and Engagement
Content on Twitter can be shared in the form of tweets containing images, videos, and GIFs.
As of April 2023:
- 61.7% of social media users were on Twitter to keep up-to-date with news and current events in 2023.
- 36.6% of social media users were on Twitter to follow or research brands and products.
- 35.3% of social media users were on Twitter to look for funny or entertaining content.
- Android app users spent an average of 5.5 hours per month on Twitter with over 43% opening the app every day.
- 3.4% of internet users aged 16 to 64 said Twitter was their favorite platform.
Web Traffic
Twitter had 19 billion visits between February and April 2023 and an average of 6.3 billion monthly visitors. The average time per visit was 10 minutes and 33 seconds and users visited around 9 pages.
Revenue
Twitter generates most of its revenue through advertising. In 2022, the company generated $4.14 billion in revenue. However, its global revenues are expected to drop to $2.98 billion in 2023.
YouTube Data
Launched in 2005 and acquired by Google in 2006, YouTube has grown into the world’s largest online video platform. On YouTube, users can:
- Share and discover video content.
- Create, share, and discover short-form videos through YouTube Shorts.
- Explore music and gaming through YouTube Music and YouTube Gaming.
- Experience ad-free videos and other premium features through YouTube Premium.
- Track, manage, and monetize video content through YouTube Studio.
YouTube also provides various ad formats and targeting options for businesses to promote their products or services.
Demographics
In April 2023, YouTube had over 2.5 billion monthly active users, with the majority of users (470 million) coming from India and the US (246 million users). The platform’s user base was made up of more men than women, with around 12% of YouTube’s total users being men aged between 25 and 34 years, and around 9% being women aged between 35 and 44 years.
Content and Engagement
In terms of content, YouTube features a wide variety of corporate and user-generated content that ranges from music and gaming videos to DIYs and educational clips.
- In April 2022 alone, over 500 hours of video were uploaded on the platform every minute.
- Android app users spent an average of 27 hours and 19 minutes on YouTube with over 63% opening the app every day in 2023.
Web Traffic
Youtube had 97 billion visits between February and April 2023 and an average of 32.3 billion unique monthly visitors. The average time per visit was 20 minutes and 27 seconds and the average user visited 11 pages.
Revenue
YouTube’s primary source of revenue is advertising. Additionally, the video platform earns money from monthly subscriptions such as YouTube Premium. In 2022, YouTube generated more than $29 billion in revenue, 11.35% of parent company Alphabet’s total annual earnings.
In Q1 of 2023, YouTube’s ad revenue fell 2.6% year-over-year. YouTube only made $6.69 billion in advertising revenue for the first quarter of 2023 compared to $6.87 billion in the same period last year.
Pinterest Data
Pinterest is a visual discovery platform launched in 2010 by Pinterest Inc. that allows users to:
- Discover visual content, including images, videos, and GIFs, across various topics and interests.
- Save or pin content to personalized pin boards.
- Create, manage, and share boards.
- Explore trending topics and discover new ideas.
- Create pins and boards to share with other users.
- Follow other users or specific boards and collaborate on shared boards.
- Discover and shop products showcased in pins.
Pinterest also provides various ad formats and targeting options for businesses to promote their products or services.
Demographics
As of April 2023, Pinterest had 463 million monthly active users. The US accounted for the largest Pinterest audience size, with a total of 90 million users. Brazil ranked in second position with 34.2 million users, followed by Mexico and Germany. Pinterest’s audience is 79.5% female with the app being most popular among women between the ages of 25 to 34 years.
Content and Engagement
Content types on Pinterest include images, videos, and GIFs across a multitude of interests, hobbies, and more. The most popular pinboard themes range from recipes and DIY to fashion and lifestyle.
As of April 2023:
- 36.5% of social media users were on Pinterest to follow or research brands and products.
- 21% of social media users were on Pinterest to look for funny or entertaining content.
- 13.7% of social media users were on Pinterest to post or share videos or photos.
- 1.5 % of internet users aged 16 to 64 said Pinterest was their favorite platform.
Web Traffic
Pinterest had 3 billion visits between February and April 2023 and an average of 1 billion unique monthly visitors. The average time per visit was 5 minutes and 46 seconds and users visited around 6 pages.
Revenue
Pinterest generates most of its revenue from advertising. In 2022, the company’s revenue was $2.8 billion, an 8.71% increase from 2.5 billion in 2021. Pinterest’s annual revenue has steadily risen over the years and its US audience remains the company’s biggest profit driver.
Snapchat Data
Snapchat is a popular social messaging app launched in 2011 by Snap. The app allows users to:
- Share ‘Snaps’ or disappearing photos, videos, and messages.
- Create and share compilations of snaps for 24 hours.
- Apply creative tools and augmented reality effects such as filters and lenses.
- Discover and explore curated content from creators and brands.
- See the real-time location of friends on a map.
- Shop in-app.
- Chat with an AI-powered chatbot called My AI.
Snapchat also offers advertising solutions for businesses.
Demographics
Snapchat had 654 million users and 383 million daily active users in April 2023. India had the largest Snapchat audience, with around 182.4 million users while the US ranked second with 108.8 million users. 18 to 24-year-olds accounted for 38.6% of Snapchat users, making them the app’s largest age group. Additionally, women were slightly more likely to use Snapchat, with 51% percent of Snapchat users being female.
Content and Engagement
Content on Snapchat can be shared in the form of images, videos, snaps, and stories. Snapchat’s internal data shows that users spend an average of 30 minutes a day on the platform.
As of April 2023:
- 41.5% of social media users were on Snapchat to post or share photos or videos.
- 36% of social media users were on Snapchat to message friends and family.
- 33.1% of social media users were on Snapchat to look for funny or entertaining content.
- Android app users spent an average of 3 hours and 17 minutes per month on Snapchat with over 39% opening the app every day.
- 1.4% of internet users aged 16 to 64 said Snapchat was their favorite platform.
Web Traffic
Snapchat had a total of 485.9 million visits between February and April 2023 and an average of 161.9 million monthly visitors. The average time spent on Snapchat was 5 minutes and 44 seconds and the number of pages visited was around 5.
Revenue
Snapchat generates revenue primarily through advertising and premium subscriptions. In 2022, its annual revenue was $4.6 billion, up from $4.1 billion in 2021. The company’s revenue has risen steadily over the years, with North America accounting for most of its revenue.
LinkedIn Data
LinkedIn, the world’s largest professional networking platform was launched in 2003 and acquired by Microsoft in 2016. On the LinkedIn platform, users can create a professional profile and gain access to:
- Professional connections.
- Free networking and job search features.
- Recruitment and Talent solutions.
- Premium job search and recruitment features.
- Professional networks and recommendations.
- News feed posts, articles, and updates.
- LinkedIn learning and skills development.
- Companies, groups, and industry influencers.
LinkedIn also offers marketing and advertising solutions for businesses.
Demographics
LinkedIn had 310 million monthly active users and over 920 million registered users in April 2023. LinkedIn’s largest user base is in the US where there were over 200 million users as of April 2023. With 100 million users, India is the second-largest market for the platform, followed by Brazil, with 62 million users. 520 million or 55.8% of LinkedIn’s total users are aged between 25 and 34. Additionally, the platform is more popular with men, who account for 56.8% of all users.
Content and Engagement
Content on LinkedIn can be shared through image posts, videos, slides, text-based updates, articles, and more.
As of April 2023:
- 26.9% of social media users were on LinkedIn to keep up with news and current events.
- 23.5% of social media users were on LinkedIn to follow or research brands and products.
- 13.8% of social media users were on LinkedIn to post or share photos or videos.
- 0.9% of internet users aged 16 to 64 said LinkedIn was their favorite platform.
Web Traffic
LinkedIn had 4.9 billion visits between February and April 2023 and an average of 1.6 million unique monthly visitors. The average time per visit was 7 minutes and 34, with users visiting around 8 pages.
Revenue
LinkedIn generates revenue through its advertising, recruitment solutions, and premium subscriptions. In 2022, LinkedIn’s annual revenue amounted to more than $13.8 billion – up from around $8 billion in 2020.
Who Uses Social Media?
Social media users made up 59.4% of the total population in January 2023.
Social media users over 18 accounted for 77.8% of the total global population of people aged 18 and older.
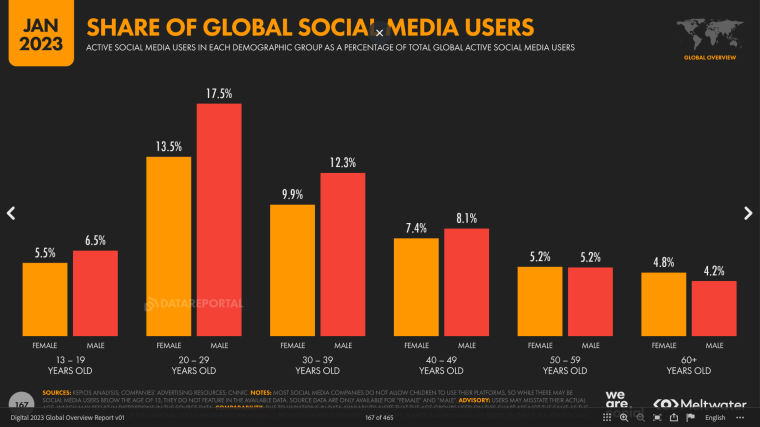
Men make up 53.7% of the total global share of social media users while women make up 46.3% in 2023.
Furthermore, Millennials are the largest audience on social media, making up 37% of all users.
Generally, women spend more time on social media.
Women aged 16-24 in particular, spend the most time (3 hours and 11 minutes) on social media each day while men aged 55 to 64 spend the least time on social networks. Across all genders, time spent on social media decreases with age.
Why Do People Use Social Media?
2023 Trends in Social Media Usage
An increasing number of social media users are using social platforms to watch or follow sports.
Research by GWI revealed the fastest growth in social media users watching or following sports. Growth is evident across major platforms like Twitter, Facebook, Instagram, and TikTok.
There is a 46% year-over-year increase in Twitter conversations about the cost of food.
Inflation and economic uncertainty have shifted how the world eats, with food lovers turning to social media to discuss everything from costs to fine dining online.
60% of Gen Z professionals use social media for work on a daily basis.
This is compared to just 1 in 3 professionals between the ages of 55 and 64.
More than 90% of working professionals aged 16 to 24 use social media for work-related communication.
This is compared to less than 2 in 3 professionals between the ages of 55 and 64.
Across all age groups, men are more likely than women to use social media for work communications.
It is interesting to note, however, that women are more likely to use social media outside the office.
More internet users are turning to social platforms to conduct work research.
The top platforms used for work research include
- YouTube – 68%
- Facebook – 58%
- Instagram – 53%
Over 59% of women between the ages of 16 and 34 follow influencers on social media.
More women than men follow influencers on social media. Over 50% of women follow influencers or other experts on social media compared to 47% of men.
2022 Social Media Usage Trends
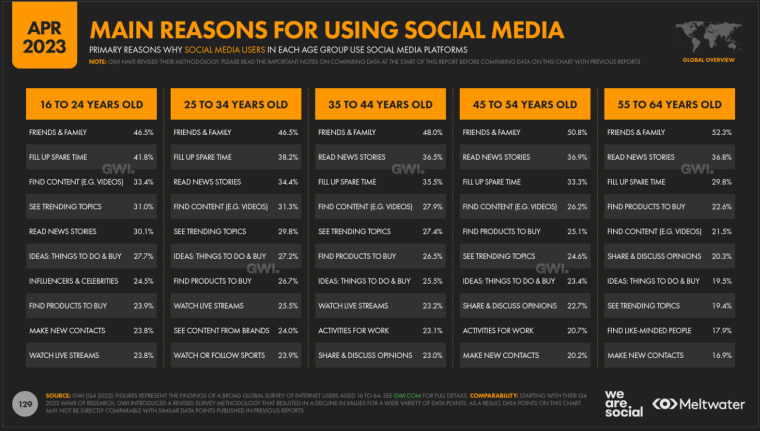
According to research by GWI some of the main reasons social media users aged 16 to 64 used social media platforms in 2022 were
- Keeping in touch with friends and family – 48.2%
- Spending spare time – 36.8%
- Reading news stories – 34.5%
- Finding content – 29.2%
- Discovering what’s being talked about – 27.6%
- Inspiration for things to do and buy – 25.5%
- Finding products to purchase – 25.3%
82.7% of social media users aged 16 to 64 used at least one social platform to conduct brand or product research.
22% of social media users discovered new products through recommendations or comments on social media while 16% discovered them through updates on brands’ social media pages.
43% of consumers looked for more information about brands, products, or services through social networks.
In a survey by GWI, 76% of consumers said user-generated content impacted their purchasing decisions and that it was 9.8 times more effective than influencer content.
91% of luxury fashion netizens used social media to influence their purchases in 2022.
A majority of fashion-loving internet users found, created, and shared their fashion inspiration through social media compared to 67% of the global general public.
40% of 18 to 24-year-olds used social media as their primary search engine in 2022.
Based on an internal study by Google, younger internet users turned to social platforms for travel tips, recipes, and news in 2022.
Where Do People Use Social Media?
We Are Social’s 2023 Global Digital Report revealed that as of April 2023:
Eastern Asia had the most social media users.
With a 29.4% share of global social media users, Eastern Asia has the most people going online for social interactions. The highest levels of social media adoption are found in the United Arab Emirates, where adoption levels are over 105.5%.
Nigeria, Brazil, and South Africa spent the most amount of time on social media.
Japan, South Korea, and Austria spent the least amount of time on social media. The US was slightly below the global average with users in the region spending an average of 2 hours and 11 minutes per day.
Social media users in Brazil used the most social platforms while Japan used the least.
The average social media user in Brazil was on 8 social platforms while the average social media user in Japan was on 3.
Social media’s share of online time was highest in India and lowest in South Korea.
Time spent using social media as a percentage of total time spent on the internet was 44% in India compared to 22% in Korea.
Kenya had the highest percentage of social media users visiting social media to learn about brands while Japan had the lowest.
65% of social media users in Kenya used social media to learn more about brands, while only 25% did so in Japan.
The Philippines had the highest percentage of social media users following influencers on social media while Russia had the lowest.
46% of social media users in the Philippines followed influencers on social media, while only 6% did so in Russia. Worldwide, 22% of social media users followed influencers.
Nigeria had the highest percentage of social media users using social media for work activities while Japan had the lowest.
61.9% of social media users in Nigeria used social media for work-related activities, while only 9.6% did so in Japan.
Influencer Marketing and Social Media
Social Media influencer marketing leverages the power of online platforms such as Instagram, TikTok, and YouTube. Businesses can collaborate with influencers to reach wider audiences, build brand awareness, and drive engagement. By tapping into the trust and authenticity influencers have with their followers, businesses can effectively promote their products and boost sales. The different types of influencers businesses can work with include:
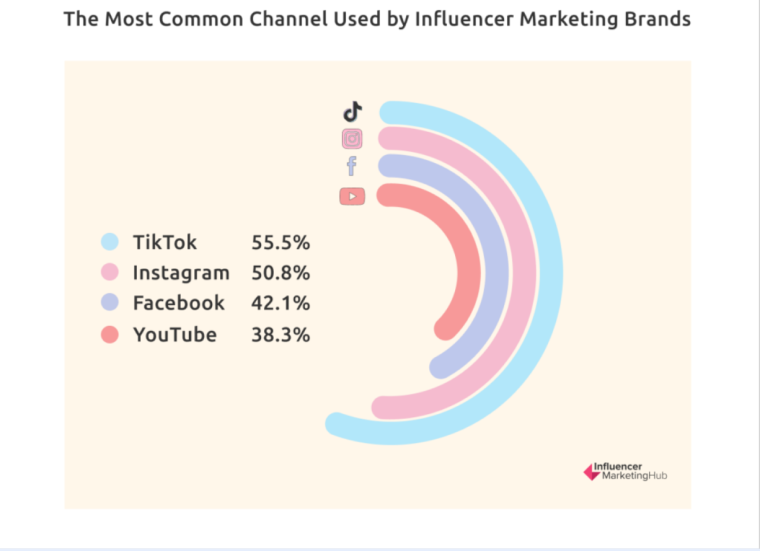
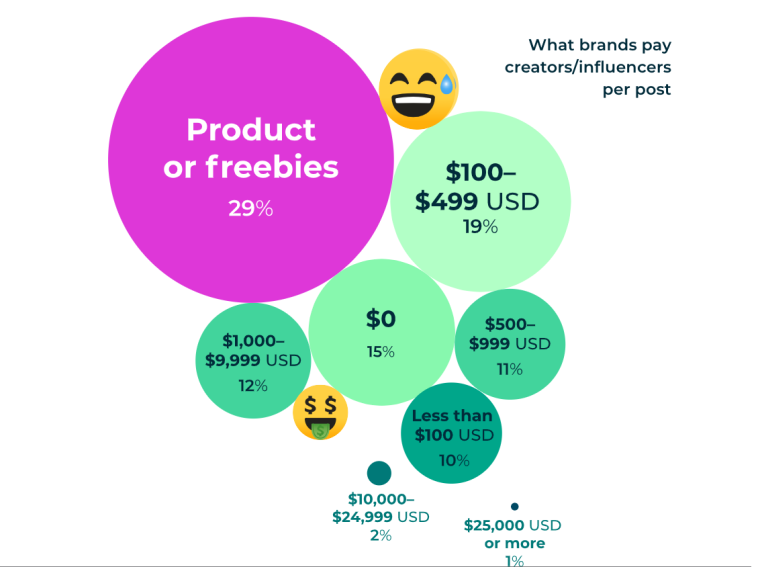
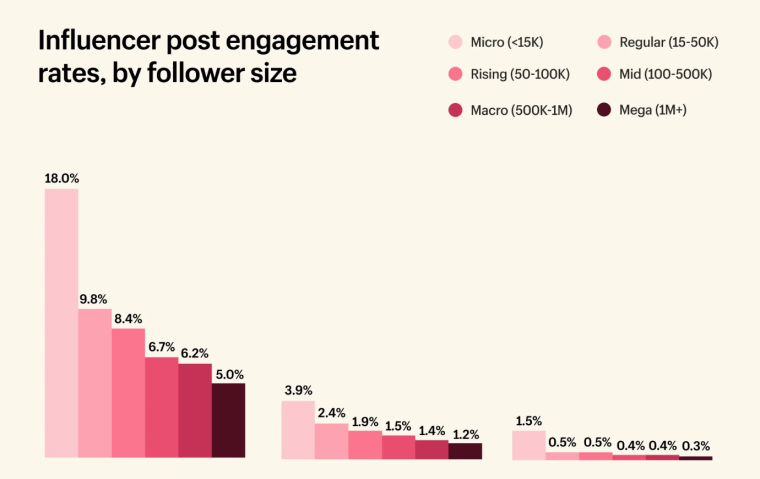
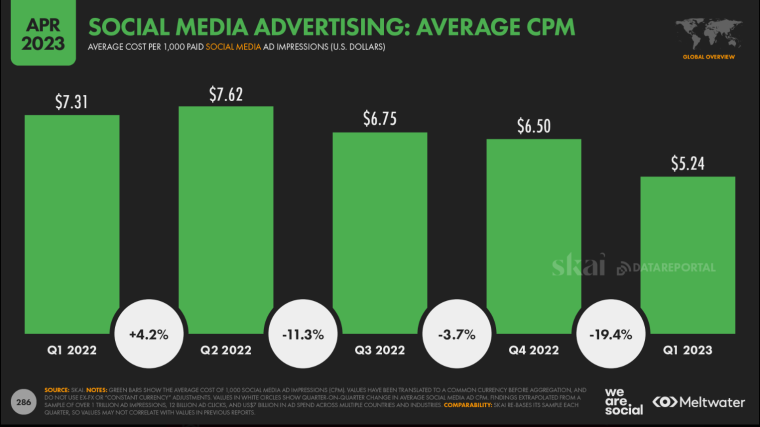
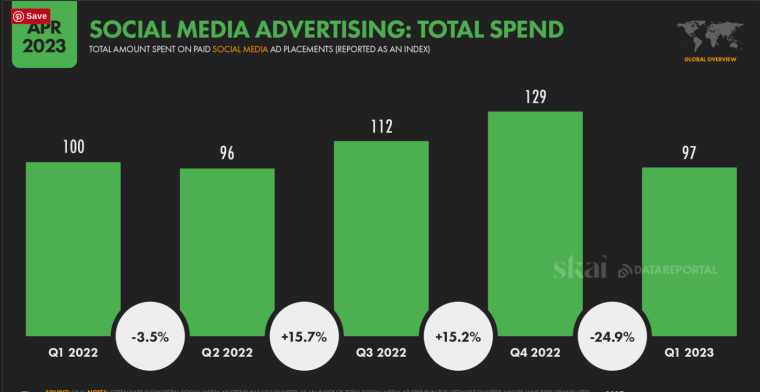
For every $1 spent on influencer marketing, brands can earn up to $5.78 in return. In terms of return on investment (ROI), influencer marketing is considered one of the most effective forms of digital marketing. This significant ROI is why 91% of marketers believe that influencer marketing is an effective marketing strategy. Spending on influencer marketing was $9.7 billion in 2020 and was projected to hit $15 billion by 2022. Influencer marketing saw a spike during the pandemic as brands turned to influencers to maintain connections with their audiences. As of January 2023, the global influencer market was estimated to be worth $21.1 billion. This was up from about $16.4 billion in 2022. The global influencer marketing market has more than doubled since 2019 and shows no signs of slowing down. In a survey conducted by Takumi, 69% of marketers agreed that influencer marketing budgets post-pandemic represented a greater portion of their marketing spend. Additionally, marketers stated that they were using more social media channels per influencer marketing campaign compared to pre-pandemic. In 2023, 90% of marketers believe that influencer marketing is effective. Influencer marketing allows businesses to reach wider, higher-quality audiences, making it a key part of any digital marketing strategy. In fact, 72% of marketers agree that influencer marketing provides higher-quality customers. 64% of marketers used influencer marketing or planned to do so in 2022. Influencer marketing has emerged as a well-established and widely accepted marketing channel. Not too long ago, leveraging influencers on platforms like Instagram or YouTube was seen as a niche approach with limited mainstream recognition. 72% of small businesses in 2023 (those with less than 100 employees) don’t work with influencers. However, nearly 42% of businesses with over 1,000 employees do work with them. Small businesses cite cost as a major limiting factor. According to Hootsuite’s 2023 Social Trends report, most influencers/creators are paid less than $100 per post. Although free samples are still the most common method of payment, 2023 figures show a decrease in its popularity from 2021. As economic pressure mounts, businesses now require greater returns and effectiveness levels from their influencer marketing spending. A new 2023 study by Influencer Marketing Hub revealed that: In 2021, Instagram was the most popular platform for influencer marketing campaigns. In 2021, the number of brand-sponsored influencer posts on Instagram surpassed three million, making the global Instagram influencer market a $15 billion business. 97% of influencers used Instagram while: While mega-influencers have an impressive following, micro-influencers also have a significant impact. This is especially the case with TikTok, where nano and micro-influencers are increasingly generating higher engagement rates. In 2020, TikTok had over 106,000 influencers worldwide, up from 16,400 in 2018 and 35,500 thousand in 2019. Shein was the most active brand on TikTok in 2020, working with over 4,000 influencers. The main objective of influencer marketing campaigns in 2023 is to generate user-generated content (UGC). As per Influencer Marketing Hub’s report, generating UGC has jumped ahead as the main reason for influencer marketing campaigns in 2023 (45%), with sales (29%) and awareness (26%) both falling behind in importance. This is driven by TikTok’s growing popularity for influencer marketing with many brands engaging influencers to set up dance challenges and the like on their behalf. Social media advertising, which is the second most popular form of digital advertising, allows businesses to accomplish multiple goals such as building brand awareness, driving website traffic, generating high-quality leads, increasing brand signals, and boosting sales. In January 2023, social media’s share of total digital advertising spend was 33.9%. Businesses and brands spent 6.9% more on social media marketing than in 2022. As of January 2023, annual spend on social media advertising was $226 billion. Spending increased by 23.2% or $43 billion from 2022, with spending expected to reach $300 billion in 2024. The US is the leading social media ad market. The US spent $80.67 billion on social media ads in 2022, making it the leader in social ad spending. In second place was China, which spent $80.55 billion on social media advertising in 2022. 27% of consumers discover new brands or products through social media advertising. This highlights the significant impact and reach of social media in today’s digital marketing landscape. Social media impression numbers have improved year-on-year by close to 20%. More advertising is being viewed by social media users. This is especially true for more passive types of ads such as videos or stories. CPM – or Cost Per Mille – is an advertising metric to measure the cost of reaching 1,000 ad impressions. According to Statista, there were over one billion social media ad impressions in late 2022. There was a 19% drop in CPM between Q4 2022 and Q1 2023. CPM across social media platforms fell from $6.50 in Q4 2022 to $5.40 in Q1 2023. CPM decreased by 28% year-over-year. The cost per thousand impressions across social media platforms fell from $7.31 in Q1 2022 to $5.24 in Q1 2023. As of October 2021, Pinterest had the highest CPM, at $30. Twitter had the lowest at $6.46. Statista reported that the average CPM of advertising on social media was $8.15 in the third quarter of 2022. CTR – or Click-Through Rate – is a digital advertising metric used to measure how effectively an ad campaign generates clicks. CTRs declined by 12% between 2022 and 2023. As per Skai’s research, there was a year-on-year decline of about 12% in average click-through rates on social media ads. Additionally, research by Statista revealed that the click-through rate for social media platforms in the Q3 2022 was 1.21% – down from 1.3% in Q3 2021. Social media advertising has become an important part of modern marketing strategies, with the biggest social platforms in the world, such as Facebook, Instagram, Twitter, and YouTube, offering businesses unparalleled reach, targeting, and analytics capabilities. According to a Statista survey conducted among B2B and B2C marketers worldwide, 22% of respondents said that Facebook was the social media platform with the highest return on investment (ROI). Instagram, YouTube, and TikTok all ranked second with 16% of respondents, followed by LinkedIn with 7%. Facebook’s powerful algorithm, vast amounts of user data, and high click-through rates make it the most popular social advertising platform. Businesses have access to a variety of ad formats, including image ads, video ads, carousel ads, and collection ads, to promote their products and services. Using Meta’s powerful analytics tools, businesses can track the performance of their campaigns for actionable insights. As of April 2023, Facebook had a potential reach of 2.25 billion, which is 43.4% of all internet users, and 28% of the global population. Overall, this represents a year-over-year increase in ad reach of 5% or 108 million. Facebook advertising has: Additionally; With Instagram advertising, businesses can promote their products or services through image and video ads that appear in users’ feeds, stories, and discover pages. Additionally, Instagram’s shoppable ads encourage product discovery and impulse buying, making it one of the most influential social media platforms for social commerce. Furthermore, using Meta’s analytics tools, businesses can track the performance of their campaigns for powerful, actionable insights. As of April 2023, Instagram had a potential reach of 1.63 billion, which is 31.4% of all internet users, and 26.6% of the global population. This represents a year-over-year increase in ad reach of 12.2% (176 million). Instagram advertising has an average: Additionally; Twitter offers several paid ad options that can be targeted based on keywords, interests, behaviors, and more. Businesses can make use of promoted Tweets, promoted accounts, promoted trends, promoted moments, and automated ads to engage their audiences. Using Twitter’s analytics tools, businesses can also track the performance of their campaigns for powerful, actionable insights. As of April 2023, Twitter had a potential ad reach of 372.9 million, which is 7.2% of all internet users, and 4.6% of the global population. Overall, Twitter’s ad reach in 2023 represents a year-over-year decrease of 19.8% or 92 million. Twitter advertising has an average As video content continues to grow in popularity, YouTube is becoming one of the most effective platforms for attracting large audiences. YouTube offers businesses access to powerful targeting tools along with multiple ad formats such as skippable, non-skippable, bumper, and overlay ads across mobile and desktop. Using YouTube’s analytics tools, businesses can also track campaign performance for powerful, actionable insights. As of April 2023, YouTube had an audience reach of 2.53 billion, which is a drop of 35 million or 1.4% from 2022. The video platform’s audience represents 48.8% of total internet users and 31.5% of the world’s population. YouTube advertising has an average: TikTok offers several paid advertising options, including in-feed video ads, branded hashtag challenges, brand takeovers, topview ads, and branded effects, which allow businesses to promote to audiences in engaging ways. Businesses can also get powerful insights into their campaigns through TikTok’s analytics tools. As of April 2023, TikTok had an audience reach of 1.09 billion. This is up 122 million or 12.6% from 2022 and represents 21.1% of total internet users and 13.6% of the world’s population. TikTok’s ad audience is 53.4% female and 46.6% male. Advertisers can also reach 20.6% of females and 18.2% of males older than 18 years old. TikTok advertising has an average Pinterest offers businesses ad solutions such as promoted pins that appear at the top of users’ feeds. Ads can be targeted based on keywords, interests, behaviors, and factors such as geography, demographics, and device. Through Pinterest’s analytics, businesses can track their ad performance to gain actionable insights into their efforts. Because over 90% of Pinterest users log on to seek shopping inspiration, the platform works exceptionally well for business-to-consumer (B2C) brands and offers a higher return on ad spend than other social media platforms. As of April 2023, Pinterest had a potential reach of 282.5 million, which is 5.5% of all internet users, and 3.5% of the global population. Overall, this represents a year-over-year increase in ad reach of 20.2% or 48 million. Pinterest advertising has an average: LinkedIn’s objective-based advertising options make it an effective platform for businesses looking to target all the stages of their conversion funnel. Ad options on LinkedIn include sponsored content, sponsored messaging, text ads, and dynamic ads. Conversion rates, especially for B2B brands, tend to be higher on LinkedIn because of the unique user demographics. As of April 2023, LinkedIn had a potential reach of 922.3 million, which is 17.8% of all internet users, and 11.5% of the global population. Overall, this represents a year-over-year increase in ad reach of 11.4% or 94 million. LinkedIn advertising has an average: Snapchat has six different ad formats, and its ad solutions make creating ads easier. Whether they have awareness, consideration, or conversion goals, Snapchat allows advertisers to align their ad campaigns with their business objectives while making the most of their budget. As of April 2023, Snapchat had a potential ad reach of 654.4 million, which is 12.6% of all internet users, and 8.2% of the global population. Overall, this represents a year-over-year increase in ad reach of 11% or 65 million. Snapchat advertising has an average:
Social Media Advertising Stats
Social Media CPM Data
Platform
Average Cost Per 1000 Impressions (CPM)
LinkedIn
$6.59
Twitter
$6.46
Snapchat
$2.95
Facebook
$7.19
Instagram
$7.91
YouTube
$9.68
TikTok
$10.00
Pinterest
$30.00
Platform
Potential Ad Reach as of April 2023
Year-on-Year Change
Facebook
2.25 billion
+5%
Instagram
1.63 billion
+12.2%
Twitter
372.9 million
-19.8%
YouTube
2.53 billion
-1.4%
TikTok
1.09 billion
+12.6%
Pinterest
282.5 million
+20.2%
LinkedIn
922 million
+11.4%
Snapchat
654.4 million
+11%
Social Media CTR Data
Platform
Average Cost Per Click (CPC)
Twitter
$0.38
Snapchat
$0.57
Facebook
$0.97
TikTok
$1.00
Pinterest
$1.50
YouTube
$3.21
Instagram
$3.56
LinkedIn
$5.26
Social Media Advertising Platform Data
Facebook Advertising
Audience Reach
Key Advertising Metrics
Instagram Advertising
Audience Reach
Key Advertising Metrics
Twitter Advertising
Audience Reach
Key Advertising Metrics
YouTube Advertising
Audience Reach
Key Advertising Metrics
TikTok Advertising
Audience Reach
Key Advertising Metrics
Pinterest Advertising

Key Advertising Metrics
LinkedIn Advertising
Audience Reach
Key Advertising Metrics
Snapchat Advertising
Audience Reach
Key Advertising Metrics
References
