By comparing figures in financial statements, ratio analysis reveals a company’s financial health, operational efficiency, and use of resources. Whether you’re a business owner, manager, or investor, the valuable insights unlocked by a ratio analysis are the edge you need to make informed decisions and optimize your strategies.
At Business2Community, we understand that a ratio analysis can seem like a complex undertaking, especially considering all the data and calculations involved in the process. That’s why we’ve prepared a step-by-step guide, including examples, to help you leverage this powerful technique.
Ratio Analysis – Key Takeaways
- Ratio analysis compares figures from a company’s financial statements to determine its financial health and overall performance.
- As a quantitative technique, it provides stakeholders with the data needed to drive informed and strategic decision-making.
- A multi-faceted approach to ratio analysis that includes contextual understanding, trend analysis, non-financial indicators, scenario planning, and predictive modeling offers a more insightful view of a company’s financial standing and prospects.
What Is a Ratio Analysis?
A ratio analysis is a quantitative method used to measure a company’s liquidity, operational efficiency, profitability and solvency. It unlocks powerful insights from a company’s financial statements, enabling sound decision-making, better use of resources, and strategic planning.
Who Needs to do a Ratio Analysis?
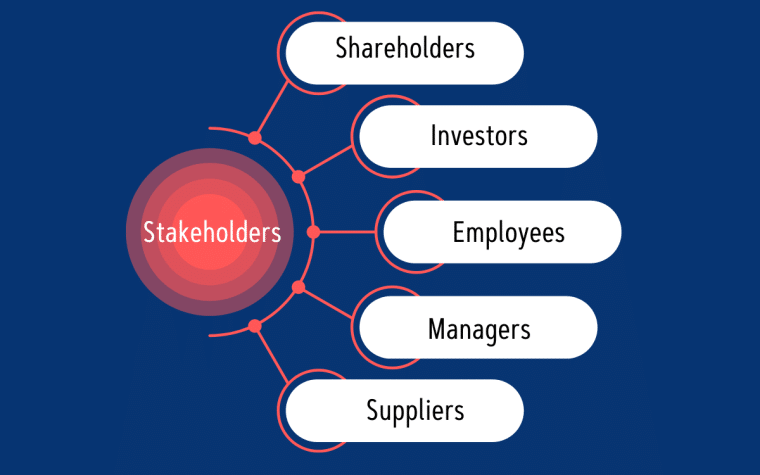
Anyone with a vested interest in the financial performance of a company can benefit from doing a ratio analysis. This includes business owners, shareholders, management teams, employees, competitors, stock traders, investors, and lenders.
These stakeholders rely on the insights provided by ratio analysis to make informed decisions related to their respective roles. For example:
- Bankers or investors use ratio analysis to make lending or investment decisions.
- Management teams leverage ratio analysis to better position a business for increased profitability and sustainable growth.
- Employees might use ratio analysis to monitor the company’s financial standing and its potential impact on their stocks, job security, or compensation.
- Competitors use ratio analysis for benchmarking purposes.
- Stock traders rely on ratio analysis to evaluate the potential investment value of companies and guide their trading decisions.

Ratio Analysis Use Cases
Ratio analysis is a valuable business evaluation tool, with broad use cases such as assessing profitability, creditworthiness, and more.
- Use case: Measuring a company’s liquidity or ability to free up cash to cover obligations and day-to-day expenses.
Example: Ratio analysis reveals that a company has a current ratio of 2. This would give a potential creditor assurance of the company’s liquidity and enhance its creditworthiness, potentially leading to more favorable loan terms or lower interest rates. - Use case: Evaluating a company’s profitability or net income earned after covering all its expenses.
Example: Ratio analysis shows that a company has a net profit margin of 35%. This shows a strong ability to convert revenue into profit and would be attractive to potential investors. - Use case: Assessing a company’s efficiency or ability to turn its resources and assets into revenue.
Example: According to a ratio analysis, a company’s asset turnover ratio is 0.6 – lower than the efficient benchmark of 1. This might prompt managers to identify inefficiencies in asset use and implement strategies to boost operational efficiency. - Use case: Comparing a company’s financial performance to different companies in the same industry.
Example: A company’s return on equity (ROE) is 5%, while the industry average is 15%. This comparison might alert a business owner of lagging performance, prompting strategic decisions to improve key areas like operational efficiency, cost management, and revenue growth.
How to Perform a Ratio Analysis
To perform a ratio analysis follow these steps:
- Step 1: Calculate Ratios (provided in the “Calculating Financial Ratios” section below)
- Step 2: Interpret what the ratios mean for your business
- Step 3: Conduct comparisons of previous periods and industry averages or benchmarks
- Step 4: Use the insights to inform decision-making, resource allocation, and strategic planning
As there are numerous financial ratios for evaluating business performance and financial health, we cover their respective calculations in detail below.
Calculating Financial Ratios
The figures needed to conduct a financial analysis can be found in financial statements such as the:
- Balance sheet
- Income statement
- Cash flow statement
Now, let’s dive into some of the most common ratios to measure a company’s liquidity, solvency, profitability, efficiency, and more.
1. Liquidity Ratios
Liquidity ratios examine a company’s ability to generate cash to meet its debt obligations. These ratios are essential for assessing a company’s financial health and its chances of staying in business for the foreseeable future. Key liquidity ratios include the current ratio and quick ratio.
Current Ratio
The current ratio, also known as the working capital ratio, tests a company’s ability to pay off its short-term liabilities using current assets. It is calculated by dividing current assets by current liabilities.

Quick Ratio
The quick ratio or acid test ratio is a stricter form of the current ratio and measures a company’s ability to cover short-term liabilities using its quick assets. It is calculated by subtracting inventory from current assets and dividing that figure by current liabilities.

Generally, liquidity ratios greater than 1 imply good liquidity, while those under 1 point to liquidity issues.
2. Solvency Ratios
Solvency ratios or leverage ratios compare a company’s debt levels to its assets, annual earnings, or equity, for a clearer picture of its ability to meet its long-term financial obligations.
Debt Ratio
The debt ratio or debt to total assets ratio measures the share of a company’s assets financed by debt and is calculated by dividing total liabilities by total assets.

Equity Ratio
The equity ratio measures the share of company assets financed by shareholders’ equity. It is calculated by dividing shareholders’ equity by total assets.

Debt-to-equity Ratio
The debt-to-equity ratio compares a company’s total liabilities to its shareholder equity. It is calculated by dividing total liabilities by shareholders’ equity.

Higher leverage ratios suggest greater risk due to an increased reliance on debt while lower ratios imply a more conservative financial structure with less reliance on debt.
3. Profitability Ratios
Profitability ratios assess how well a company can generate income from its operations. Comparing these ratios with industry averages can provide insights into a company’s competitive position.
Gross Profit Margin
The gross profit margin ratio measures how much profit a company makes for each dollar of its sales after covering the cost of goods sold. It is calculated by dividing gross profit by total revenue.

Net Profit Margin
The net profit margin ratio shows the percentage of sales converted into profits. It is calculated by dividing net income by total revenue.

Return on Equity
Return on equity (ROE) indicates how well a company uses its shareholders’ equity to generate profit. It is calculated by dividing the company’s net income by its total shareholders’ equity.

Generally, higher profit margins and returns suggest a competitive advantage or indicate strong control over costs and efficient operations. According to the NYU Stern School of Business, the average net margin is 8.89%, but this varies across industries. Use their list to find your industry average.
4. Coverage Ratios
Coverage Ratios measure a company’s ability to pay interest, fees, and charges related to its financial obligations. This provides insight into its financial stability and risk. A key example is the debt service coverage ratio.
Debt Service Coverage Ratio
This ratio measures a company’s ability to pay off its debt obligations using operating income. It is calculated by dividing net operating income by total debt service.

Higher ratios suggest a better ability to meet debt obligations. Ratios below 1 suggest potential difficulties in covering debt.
5. Efficiency Ratios
Efficiency ratios measure how well a company uses its assets to generate income, providing insights into its operational efficiency and overall profitability. Key ratios include inventory turnover, asset turnover, and receivables turnover.
Inventory Turnover Ratio
The inventory turnover ratio measures how frequently a company sells and replaces its inventory. It is calculated by dividing the cost of goods sold by average inventory.

Asset Turnover Ratio
The asset turnover ratio looks at how quickly a company uses its assets to generate revenue. It is calculated by dividing the net sales by average total assets.

Receivables Turnover Ratio
The receivables turnover ratio measures how quickly a company collects receivables. It is calculated by dividing net credit sales by average accounts receivable.

Generally, higher turnover ratios point to better efficiency and overall business performance, while low ratios suggest issues such as poor credit and collection policies, low sales, or excess inventory.
6. Market Ratios
Market ratios reveal a company’s perceived market value, helping investors make informed decisions about stocks and investment potential. Key ratios include the price-earnings ratio and the dividend yield ratio.
Price Earnings Ratio
The price-earnings ratio measures the current price of a company’s stock relative to its earnings per share. It is calculated by dividing the market value per share by the earnings per share (EPS).

A high price-earnings ratio suggests market expectations of future growth, while a low ratio may indicate a stock is undervalued or experiencing low growth expectations.
Dividend Yield Ratio
The dividend yield ratio shows the percentage of a company’s share price that is paid out in dividends to shareholders. It is calculated by dividing the annual dividends per share by the market price per share.

A high dividend yield ratio implies that a stock provides a higher income return in dividends relative to its price, while a low dividend yield suggests a stock offers lower income from dividends compared to its price.
Ratio Interpretation
For an accurate view of business performance:
- Analyze and compare your ratios over several years to identify financial difficulties that would otherwise not be apparent in a single year’s analysis.
- Compare your results to companies in the same industry.
Examples of Ratio Analysis
Liquidity, efficiency, and profitability ratios are examples of ratios that can be combined to give a balanced perspective of how a company is doing.
Measuring Liquidity
Suppose a clothing boutique has current assets of $500,000 (including cash, inventory, and accounts receivable) and current liabilities of $250,000 (including accounts payable and short-term debt). We can use the current ratio to measure its liquidity.

As the company’s current ratio is 2.0, it has twice as many current assets as current liabilities. This indicates strong liquidity and financial health, suggesting that it will be able to cover its financial obligations.
Assessing Profitability
Consider a local food delivery app that has a net income of $200,000 and shareholders’ equity of $1,000,000. We can use return on equity to assess its profitability.

A return on equity of 20% represents a moderate level of profitability and while the company is effectively generating profits from its equity, there is room for improvement.
Evaluating Operational Efficiency
Let’s consider an HVAC supplier that has total sales of $250,000 and average total assets of $1 million for the year. We can use the asset turnover ratio to evaluate its operational efficiency.

An asset turnover ratio of 0.25 indicates poor efficiency in leveraging assets to generate sales and could be a sign of operational challenges, underutilized resources, or poor management.
How to Adjust a Ratio Analysis
A key aspect of financial ratio analysis is accurate and comprehensive financial data. This can be achieved by following proper accounting standards and procedures and using accounting software to ensure financial records are free of errors.
Examples of other areas to focus on include:
- Increasing revenue and while streamlining processes to keep costs low to improve profitability ratios.
- Managing and leveraging debt wisely to improve debt ratios.
- Efficiently managing accounts receivable, inventory, and accounts payable to increase liquidity ratios.
Limitations of Ratio Analysis
While ratio analysis provides a great snapshot of a company’s financial standing, it has certain limitations such as:
Historical Focus
Ratio analysis is based on historical data and needs to be combined with other methods such as market trend analysis, industry analysis, economic forecasting, scenario planning, and predictive modeling to provide more comprehensive insights.
Generalization Challenges
Ratio standards that are generally considered healthy in one industry might be a sign of financial trouble in another. As such, it is important to compare ratios within the context of your specific industry. Benchmarking against industry averages or competitors enables more meaningful analysis and highlights whether a company is falling behind, excelling, or in line with industry norms.
Quantitative Focus
Ratio analysis is quantitative and doesn’t take qualitative factors such as customer satisfaction, brand value, or market dynamics into account. By incorporating non-financial indicators into ratio analysis, you stand to benefit from a more balanced and comprehensive perspective.
Other Types of Financial Ratios You Can Use
Other types of financial ratios you can use to track and benchmark a business’s performance include:
Revenue per Employee
This ratio measures the amount of revenue generated by each employee, highlighting the company’s productivity. To calculate revenue per employee, divide annual revenue by the number of employees.

For further insights on profitability and efficiency, use these ratios:
- Earnings Per Share (EPS): Measures profit per share of stock and is calculated as net income minus dividends on preferred stock divided by average outstanding shares.
- Return on Assets (ROA): Measures profitability relative to total assets and is calculated as net income divided by total assets.
- Average Collection Period: Provides the average time taken to collect receivables and is calculated as 365 divided by receivables turnover.
The Value of Ratio Analysis
Ratio analysis tracks a company’s financial position over time and benchmarks its key business metrics against industry averages. This gives various stakeholders a clearer picture of a company’s performance, empowering them to make informed decisions.
So, as a stakeholder, ratio analysis is a crucial addition to your business intelligence efforts. For insights that deliver actionable results, combine your ratio analysis with other methods like trend analysis, non-financial indicators, scenario planning, and predictive modeling.