Quantitative analysis turns numbers into powerful insights, empowering informed decision-making across any fields or industries. Whether you’re a trader, investor, business owner, analyst, or manager, quantitative analysis is the edge you need to dissect complex datasets, evaluate opportunities, mitigate risks, and enhance your competitive advantage in the market.
Here at Business2Community, we’re dedicated to empowering you with the knowledge you need to leverage quantitative analysis in your own intelligence and decision-making efforts. Dive in as we walk you through everything you need to know about quantitative analysis including how to perform it, real-life examples, and more.
Quantitative Analysis – Key Takeaways
- Quantitative analysis is a valuable business tool that uses mathematical and statistical techniques to analyze numerical data, allowing decision-makers in business and financial contexts to understand their data better, discover trends, test hypotheses, and predict future outcomes.
- Quantitative analysis methods focus on quantifying various phenomena, providing objective, measurable, and replicable findings that guide trading strategies, investment choices, resource allocation, strategic decision-making, and risk management.
- As with all research methods, quantitative analysis must be applied wisely and complemented with qualitative analysis and other business frameworks to gain more comprehensive insights.
What is Quantitative Analysis?
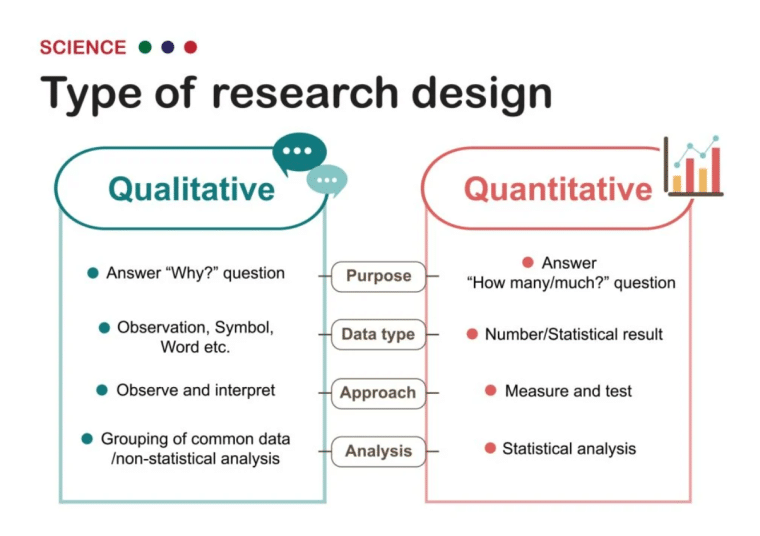
Quantitative analysis is the process of using mathematical and statistical methods to understand numerical data. Quantitative simply means something relating to the quantity of something, unlike qualitative which refers to qualities In a business context, quantitative analysis is used to explore associations, test hypotheses, uncover patterns, and make forecasts. This, in turn, guides objective decision-making, effective resource allocation, and better risk management.
Who Needs to Do a Quantitative Analysis?
As it relies on mathematical and statistical methods to analyze numerical data, anyone wanting to gain a better understanding of their data and make objective, data-driven decisions can benefit from quantitative analysis.
For example:
- Traders use quantitative analysis to enhance their trading strategies, predict market movements, and identify profitable trading opportunities.
- Investors use mathematical and statistical models to evaluate the performance of financial instruments such as stocks, bonds, and derivatives, guiding investment decisions that align with their objectives.
- Company managers apply quantitative analysis to measure operational efficiency, manage projects, forecast business trends, and make evidence-based decisions to enhance productivity and profitability.
- Company owners use quantitative analysis to assess business performance, identify growth opportunities, and optimize their strategies for a greater return on investment.
- Company directors use quantitative analysis techniques to reduce subjectivity or bias in decision-making, encouraging data-driven decision-making that supports long-term organizational goals.
- Financial analysts rely on quantitative analysis to inform resource allocation and other strategic financial decisions.
- Quantitative analysts or ‘Quants‘ leverage advanced skills in computer science, statistics, calculus, and linear algebra to develop sophisticated models for financial markets, enabling informed trading strategies, investment decisions, and risk management.
How to Perform a Quantitative Analysis
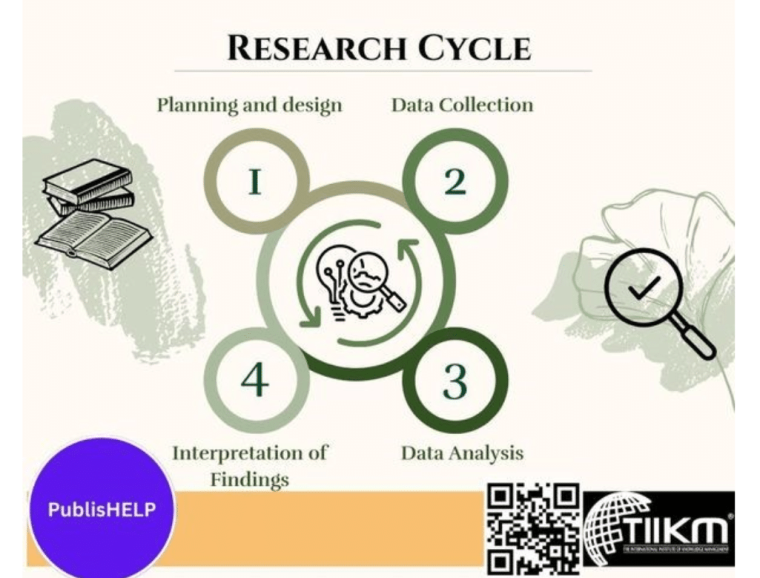
Let’s dive into a general 5-step process for performing a quantitative analysis.
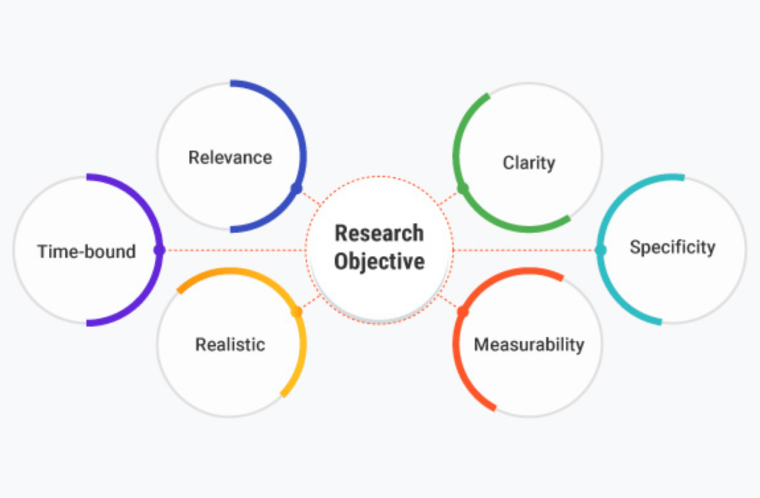
Step 1: Define Your Research Objectives
The first step is to understand your research problem and define your research objective. Research objectives allow you to identify key variables that will help guide your research design, data collection, and analysis.
Step 2: Select your Research Design
Selecting the right research design ensures that you get relevant, actionable insights from your analysis. There are four main types of quantitative research, namely;
Descriptive Research:
Descriptive research involves collecting data on a phenomenon and later formulating a hypothesis. For example, as a marketer, you might gather and analyze data on customer purchases to guide marketing strategies.
Correlational Research:
Correlational research involves simply observing two or more variables to identify, through statistical analysis, the extent and type of relationship between them. For example, as a trader, you might use correlational research to explore the relationship between interest rates and stock market performance to better understand potential market movements.
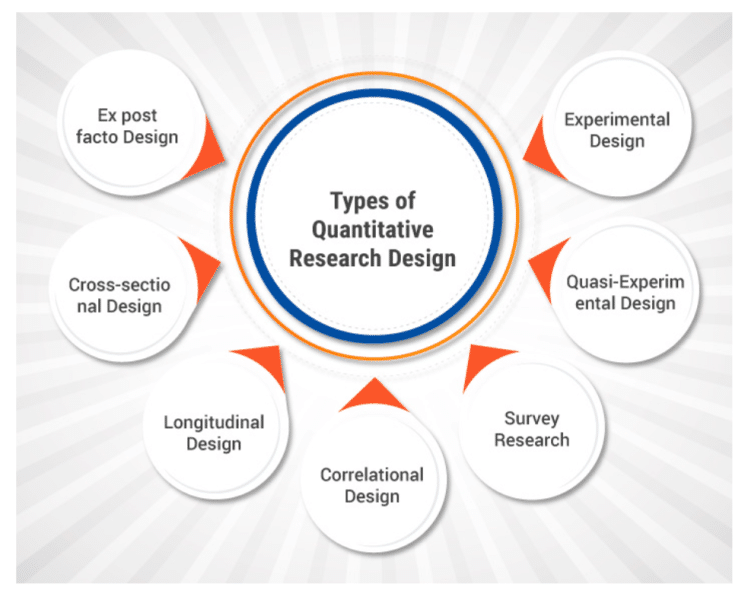
Causal-Comparative/Quasi-Experimental Research:
Causal-comparative/quasi-experimental research involves identifying cause-and-effect relationships in pre-existing groups to determine the impact of different conditions on outcomes. For example, as a business manager, you might want to study the financial performance of companies before and after adopting remote work policies.
Experimental Research:
Experimental research involves establishing cause-and-effect relationships by manipulating one variable in a controlled manner to determine its effect on another. For example, as a business owner, you might want to test the effectiveness of two different promotional strategies on new account sign-ups.
Ultimately your choice of research design depends on your research objectives. In a nutshell:
- If you want to describe a particular phenomenon without extending your results beyond your study sample, opt for a descriptive research design.
- if you want to investigate whether two variables are related, a correlational research design will do the trick.
- If you want to assess the impact of a particular strategy or intervention, consider a quasi-experimental research design
- If you want to manipulate or control for all potential variables in a highly controlled environment, a true experimental research design is the best option.
Step 3: Gather Your Data
The next step is data collection, where you’ll need to gather your data. Consider your research objectives and determine whether to collect primary or secondary data.
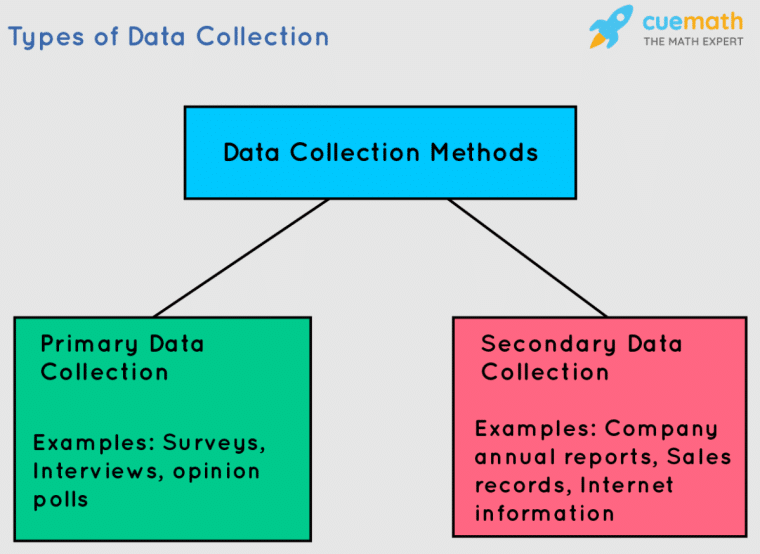
Primary Data:
Primary data is data that you gather for yourself through methods such as:
- Surveys
- Experiments
- Interviews
- Focus groups
- Observations
- User data
Secondary Data:
Secondary data is existing data collected by other researchers and typically includes:
- Government publications
- Academic journals
- Market research reports
- Company financial statements
- Websites and online databases
Step 4: Select an Analysis Method
Once you’ve collected, cleaned, and organized your data, there are various types of quantitative analysis you can use to analyze it. The most common quantitative analysis methods include:
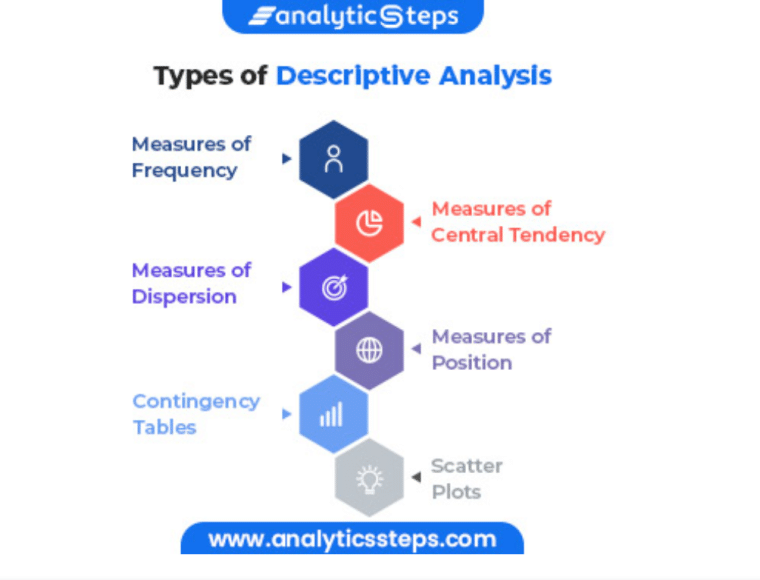
Descriptive Analysis:
Descriptive analysis summarizes and describes the characteristics of a data set through:
- Measures of central tendency: Includes the mean, median, mode, and percentiles which are used to summarize the typical value in a dataset.
- Measures of dispersion: Includes the range, standard deviation, and variance which are used to understand how spread out the data is.
- Frequency distributions: Includes histograms, bar charts, and tables that are used to visualize the data.
- Cross-tabulation: Analyzes the relationship between two categorical variables.
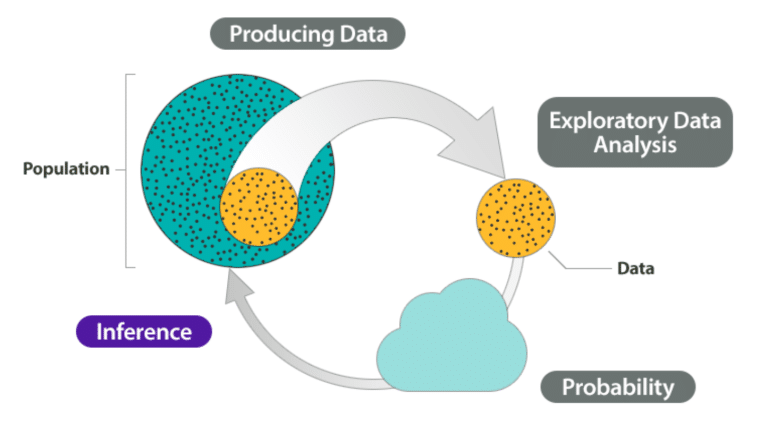
Statistical Inference:
Statistical inference uses data analysis and inferential statistics to make conclusions about a population. Key techniques include:
- Hypothesis testing: Tests specific claims about population parameters using statistical tests like t-tests, ANOVA, and chi-square tests.
- Confidence intervals: Estimates the range of plausible values that a population parameter will fall between.
- Correlation analysis: Correlation analysis assesses the strength and direction of the relationship between two variables.
- Monte Carlo simulations: A mathematical technique that helps account for uncertainty in analyses and forecasts.
Predictive Analysis:
- Regression analysis: Regression analysis is a statistical method that relies heavily on statistical equations to predict the impact of one variable on another.
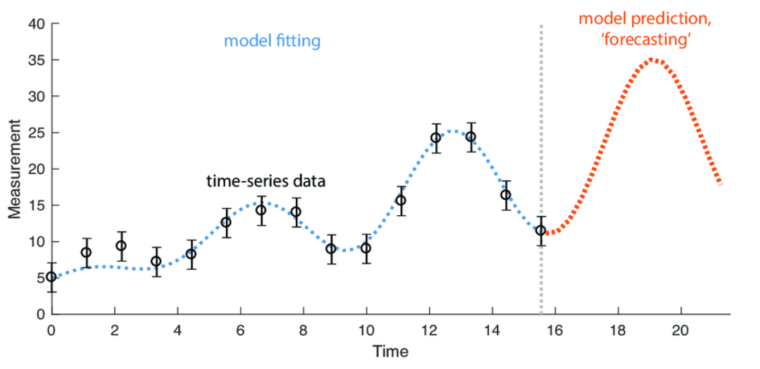
- Time series analysis: Looks at data points collected consistently over a specific period to forecast future outcomes.
- Machine learning algorithms: Artificial intelligence models that can learn from data and identify complex patterns to predict outcomes.
Data Mining and Modeling:
Data mining and modeling are broader techniques that can be used for both descriptive and inferential purposes in quantitative analysis. Key quantitative methods include:
- Linear programming: Optimizes solutions to determine the best outcome of a linear function.
- Data mining: Uses combination of computer programming and statistical methods to discover hidden patterns and relationships in large datasets.
- Factor analysis: Reduces a large number of variables into fewer numbers of factors.
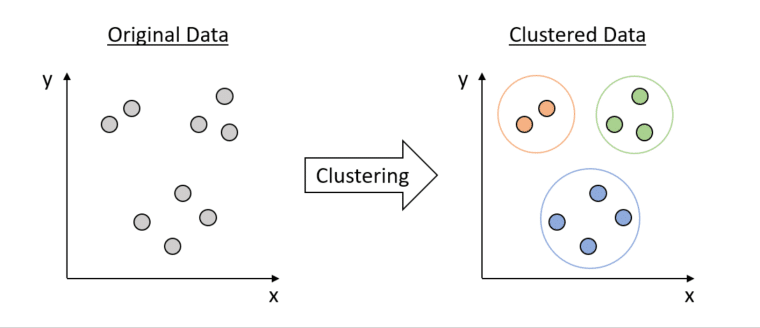
- Cluster analysis: Groups data points into clusters based on their characteristics, revealing hidden patterns and relationships in complex data sets to guide informed decision-making.
- Risk modeling: Uses mathematical models to evaluate various risk exposures within a portfolio allowing decision makers to devise better risk management strategies. Typical methods used include scenario analysis and stress testing.
Step 5: Interpret and Apply Your Findings
The final step involves interpreting your findings to transform them into actionable insights. First, evaluate your results against your research objectives and draw conclusions. Then, use the insights to inform decision-making, whether that’s guiding investment and trading decisions, or optimizing key business strategies.
Examples of Quantitative Analysis
Below, we explore two real-life examples of quantitative analysis.
Example 1: Informing Trading Strategies
Let’s consider a simple example of how quantitative analysis can be used to inform trading decisions. Note that this example simplifies many aspects of quantitative analysis in a trading context. The best trading strategies often incorporate more complex indicators, risk management techniques, and market analysis to validate strategies before implementation.
A stock trader would like to determine if a stock is in an uptrend or downtrend for potential buy or sell signals based on its short-term (10-day) and long-term (50-day) moving averages. The moving average (MA) is a common indicator calculated by averaging a security’s price over a specific period to filter out short-term noise and highlight longer-term trends.
Data collection: The trader collects the daily closing prices of the stock over the last 60 days.
Analysis and calculations: For illustration purposes, the table below shows the closing prices of the stock for days 51 to 60.
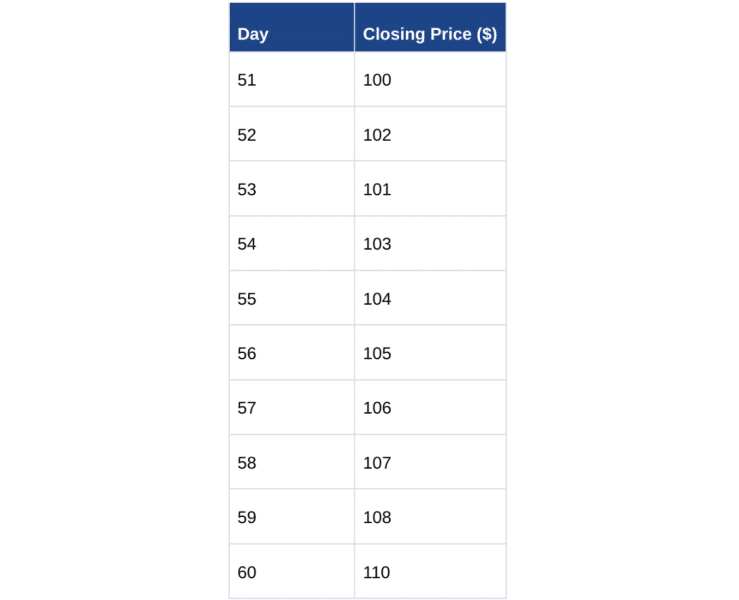
She calculates the 10-day MA by adding up the closing prices for days 51 to 60 and dividing by 10, as shown below:
(100 + 102 + 101 + 103 + 104 + 105 + 106 + 107 + 108 + 110) / 10 = 1046 / 10 = $104.60
Similarly, for the 50-day MA, she adds up the closing prices from day 11 to day 60 and divides by 50. This gives her a 50-day moving average of $95.
Interpretation and conclusion
The short-term moving average ($104.60) confidently broke above the long-term moving average ($95), suggesting an uptrend in her eyes. The trader interprets this to mean that the stock’s price may continue to rise and considers it a buy signal.
The trader commits to monitoring the stock’s performance and adjusting her position based on new data. She also understands she’ll need to supplement her analysis with additional statistical methods to drive more informed decision-making.
Example 2: Optimizing Marketing Campaigns
The marketing manager at a growing ecommerce company wants to increase the conversion rates on their product landing page. The manager thinks that changing the call to action (CTA) button from “Buy Now” to “Explore Options” might result in more conversions.
To test the hypothesis, she uses A/B testing and divides the incoming website traffic between two versions of the landing page: one version keeps the original “Buy Now” CTA (control group), while the other version uses the “Explore Options” CTA (treatment group). She ensures that other elements on the page remain constant to isolate the effect of the CTA change.
Data collection:
The control group encounters the original landing page featuring the “Buy Now” CTA, while the treatment group experiences the revised landing page with the “Explore Options” CTA. Data is gathered on website visits, clicks on the CTA button, and successful transactions for both groups.
- The control group: 150 visits and 15 purchases.
- The treatment group: 130 visits and 19 purchases.

Calculations:
She calculates the conversion rate for each group by dividing the total number of completed transactions by the total number of website visits.
Control group:
Conversion rate = 15/150 = 0.1 (10%)
Treatment group:
Conversion rate = 19/130 = 0.146 (14.6%)
Statistical analysis:
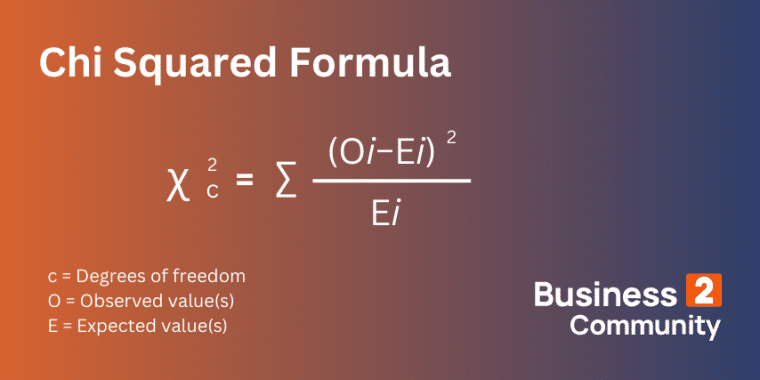
The initial results show an increase in the conversion rate for the treatment group. To see if this increase is statistically significant and not simply due to chance, the manager conducts a Chi-square test.
Chi-square test findings:
After applying the Chi-square test to compare the conversion rates of the two groups, the marketing manager discovers the following:
- Chi-square statistic: 2.74
- Degrees of freedom: 1
- p-value: 0.098
Interpretation and conclusions:
The p-value of 0.098, which is above the significance level of 0.05, suggests that the difference in conversion rates between the control group (10%) and the treatment group (14.6%) is not statistically significant at the 5% level.
This tells the manager that the increase in the conversion rate for the treatment group could be due to chance rather than the change in the CTA button text. Understanding the limitations of her simple analysis, she decides to conduct additional testing with a larger sample size to increase the reliability of the test.
When to Use Quantitative Analysis
Quantitative analysis has a multitude of use cases. Below. we detail seven key examples of how it can be used to drive better decision-making in various business contexts:
Algorithmic Trading
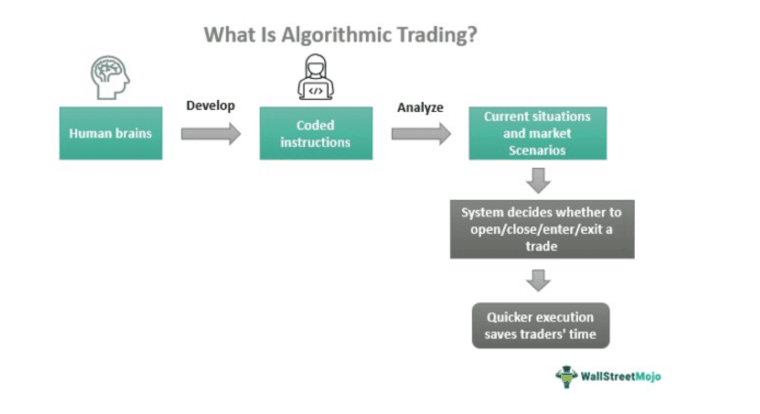
Quantitative analysis is a valuable tool for powering more efficient and informed algorithmic trading. Algorithmic trading refers to using complex computer algorithms to automate trading.
These algorithms can be designed to execute trades based on factors like timing, price movements, liquidity changes, and other market signals. They can also be programmed to do this at scale, such as in high-frequency trading (HFT). Here, a large number of trades are carried out within fractions of a second to take advantage of small price movements.
Pricing Derivatives
Derivatives are financial contracts that are valued based on other underlying assets like stocks or bonds. Derivatives pricing refers to creating mathematical models to evaluate these contracts and determine their pricing and risks. Quantitative analysis is a crucial tool for pricing derivatives as accurately as possible, resulting in better financial decisions regarding buying, selling, or hedging with derivatives.
Evaluating Investments
Quantitative techniques can be used to evaluate investments and forecast market trends. For example, an investment firm might use quantitative models to manage its index and mutual funds. By applying statistical models to evaluate the performance of various asset classes, the firm would be able to maximize returns while minimizing risks.

Optimizing Marketing Strategies
In marketing, quantitative analysis helps understand consumer behavior, preferences, and trends. It also helps businesses tailor their products and marketing strategies to target audiences. For example, through techniques such as customer segmentation, predictive analytics, and A/B testing, a business can devise effective marketing strategies, optimize product development, and ultimately improve customer satisfaction.
Measuring Performance
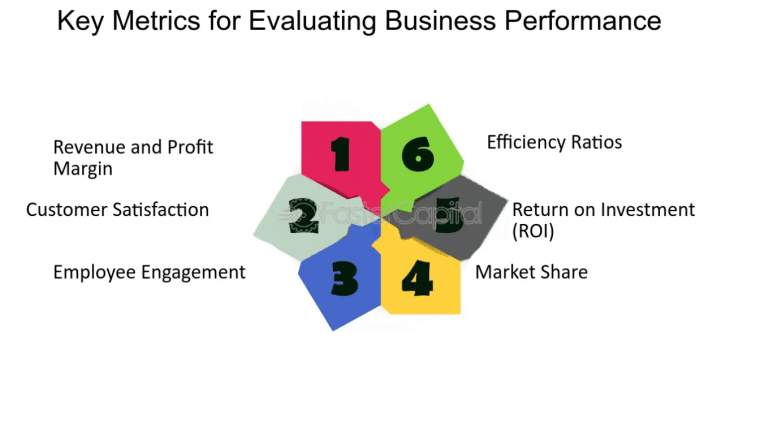
Quantitative analysis plays a vital role in performance measurement by providing objective metrics to assess the efficiency and effectiveness of various areas in an organization. For example, bottom-line quantitative analysis, key performance indicators (KPIs), ratio analysis, and benchmarking are among the key tools used to evaluate performance and improve profitability.
Optimizing Production
In production, quantitative methods provide a reliable way to control quality, reduce waste, and save money. For example, a manufacturing company might turn to statistical process control to optimize production processes, plan production schedules, monitor outputs in real time, and forecast demand.
Enhancing Project Management
In project management, quantitative analysis can be used to intelligently allocate scarce resources, schedule projects, and assess risks. For example, using techniques such as critical path analysis and project simulation models, project managers can plan, monitor, and control project activities efficiently.
How to Adjust a Quantitative Analysis
To improve your outcomes when doing quantitative analysis:
- Use measurable and verifiable data and ensure your datasets are complete, clean, and free of errors.
- Select the right statistical methods and models for your data and research objectives.
- Use descriptive statistics or simple visualization techniques to understand the characteristics, trends, and potential outliers in your data before moving on to more complex analyses.
- Validate your findings through techniques such as sensitivity analysis to ensure that your predictive models are accurate and generalizable.
Limitations of Quantitative Analysis
While quantitative analysis provides objective, measurable, and replicable findings, it has certain limitations. These include:
Numerical Data Focus
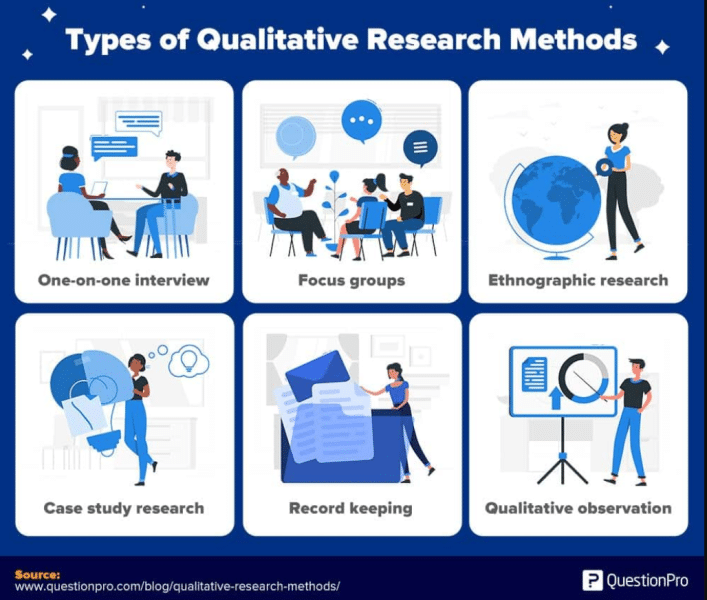
Quantitative analysis deals with numerical data, presenting information in terms of numbers and statistics. While this allows you to precisely measure variables and certain phenomena, it overlooks non-numerical data which often provides a more comprehensive understanding of a subject.
For example, it can tell you how much customer retention fell or how much conversions increased, but not why. To overcome this limitation and gain a more well-rounded perspective, integrate your analysis with qualitative analysis.
Oversimplification
Quantitative analysis may oversimplify real-world scenarios that often have multiple interacting factors and dynamic influences. For example, when evaluating a company’s performance through quantitative metrics like ROI or quarterly earnings, you might miss underlying factors like market shifts or changes in competitive dynamics, leading to inaccurate conclusions.
To overcome this limitation, combine your analysis with other frameworks such as PESTEL, scenario planning, or VRIO analysis to reveal a wider range of contributing factors.
The Value of Quantitative Analysis
Quantitative analysis refers to the powerful use of mathematical and statistical techniques to analyze numerical data, allowing professionals across various fields to measure, evaluate, and interpret complex phenomena. Its value lies in its ability to provide objective, data-driven insights that support informed decision-making.
For traders, investors, or key business decision-makers, quantitative analysis is an indispensable tool for driving informed decisions, assessing risk, forecasting market trends, and identifying investment opportunities. To counter key limitations such as limited focus and oversimplification, consider combining your quantitative analysis with qualitative methods and other frameworks like PESTEL for more comprehensive insights.
Whether you’re making trading decisions, investment choices, or strategic business plans, leverage quantitative analysis to reduce uncertainty, capitalize on opportunities, and ultimately drive success in today’s dynamic market environment.

