The price-to-book ratio provides a simple yet thorough analysis of a company’s stock and valuation. This gives businessmen, stock traders, and investors the insights they need to identify lucrative opportunities, mitigate risks, and make more informed investment decisions.
To help you leverage the power of this financial metric in your own analysis, investing, or trading efforts, we’ve put our expertise at Business2Community to good use to guide you through what a price-to-book ratio is and how to calculate it with easy-to-follow examples.
Price-to-Book Ratio – Key Takeaways
- The price-to-book or (P/B) ratio is a financial metric that evaluates the market value of a company relative to its book value.
- The metric is among the key financial ratios used to identify overvalued or undervalued stocks and drive more informed investment decisions.
- The P/B ratio shouldn’t be used in isolation for making investment decisions – consider combining it with other financial metrics and market analysis.
What is a Price-to-Book Ratio?
The price-to-book (P/B) ratio (also known as the market-to-book ratio) measures the market valuation of a company relative to its book value. It determines whether a company’s stock is overvalued, fairly valued, or undervalued. It tells you a company’s true worth and whether it is simply fueled by hype or driven by a healthy balance sheet and sound financial position.
Who Needs to Do a Price-to-Book Ratio?
Value investors, traders, market analysts, and other finance professionals looking to understand a company’s true financial position or valuation, identify good investment opportunities, and make informed investment decisions will benefit from calculating price-to-book value.
For example:
- Traders and portfolio managers can use the ratio to diversify their holdings to minimize risk while maximizing return.
- Corporate finance advisors and merger and acquisition specialists can use the P/B ratio to assess the financial health and valuation of target companies, enabling more strategic decision-making.
- Business owners and angel investors can use the ratio to decide if the business they want to buy a stake in is priced right or if they should drive for further negotiations.
How to Perform a Price-to-Book Ratio Analysis
To perform a price-to-book ratio analysis and uncover how a company’s market valuation compares to its book value, follow these key steps:
Step 1: Gather Your Data
Start by getting the market price per share for your company of interest. You can find this data on financial news sites like Yahoo Finance, stock market apps, or the stock exchange the company is listed.
For the book value per share, you’ll need financial information such as the company’s total assets, total liabilities, and the number of shares outstanding. You can find this data in the company’s balance sheet and financial statements, which are typically included in annual company reports or SEC filings.
Step 2: Do the Calculation
The formula to calculate the price-to-book ratio involves dividing the market price per share by the book value per share.
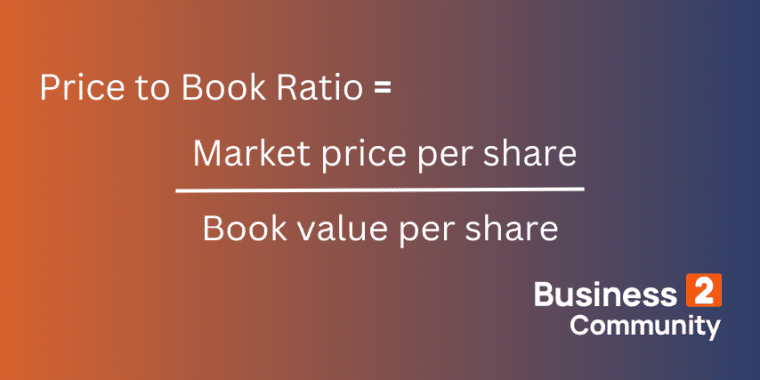
- The market price per share is the current stock price a company is listed for on the market.
- The book value per share equals total assets minus liabilities divided by the total number of outstanding shares.
To illustrate, a P/B ratio of three would mean a stock price of $3 for every $1 of book value. Similarly, a ratio of 2 would mean a stock is trading at twice its book value.
Another version of this formula, known as market to market-to-book ratio, works with total values for a company-wide valuation as opposed to a per-share basis.
The market-to-book ratio is calculated by dividing the company’s total market capitalization by its total book value.
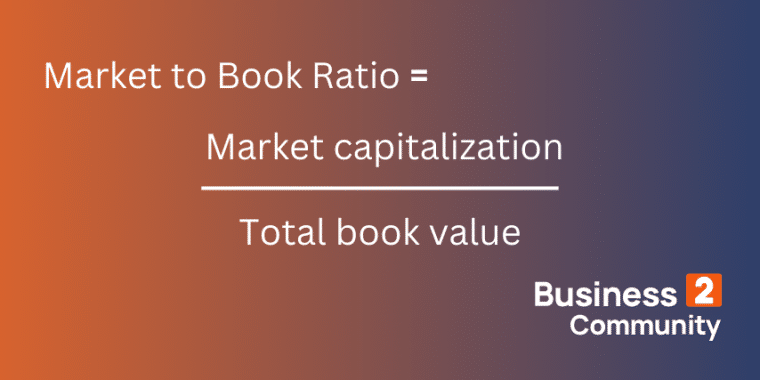
- The market capitalization is calculated by multiplying the current market price of a company’s shares by the total number of outstanding shares.
- The company’s book value is the difference between total assets minus total liabilities.
Step 3: Analyze and Interpret Your Results
Once you’ve calculated your P/B ratio, it’s time to interpret it. Generally, P/B ratios differ from industry to industry. For example, technology companies tend to have lower tangible assets and might naturally have higher P/B ratios compared to manufacturing or telecom companies with troves of physical assets.
- A P/B ratio under 1 is typically considered favorable and tends to suggest that a company’s shares are undervalued.
- A P/B ratio over 1 might suggest a company with strong growth prospects or substantial intangible assets that are not fully captured in the book value.
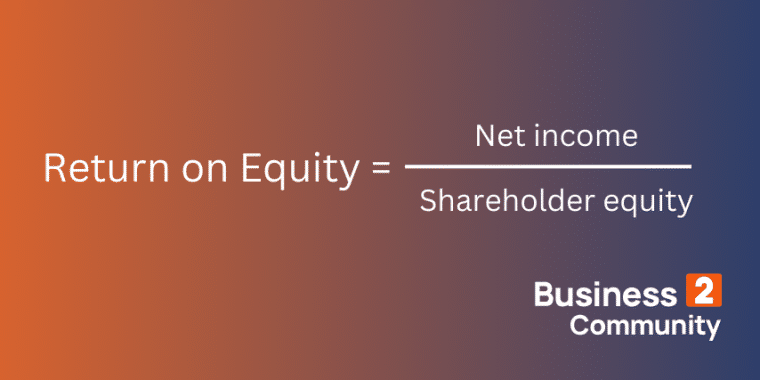
Ultimately, you’ll need to conduct a more thorough analysis and add more context to the figures before making an investment decision – the P/B ratio is a good starting point. You’ll need to consider calculating other financial metrics such as return on equity (ROE). ROE is a reliable growth indicator representing a company’s profit or net income compared to shareholders’ equity (assets minus debt) and the profit generated by the company’s assets.
Examples of Price-to-Book Ratio Calculation
To help you understand how the ratio works in practice, we’ve prepared two examples.
Example 1: Price-to-Book Ratio of a Large Technology Company
Let’s consider Microsoft’s share information and financial data, which you gather from 2023 financial statements, as shown in the images below.
- Total assets – $411,976 million
- Total liabilities – $205,753 million
- Outstanding shares – $7,432 million
- Current stock price (as of February, 14 2024) – $409.49
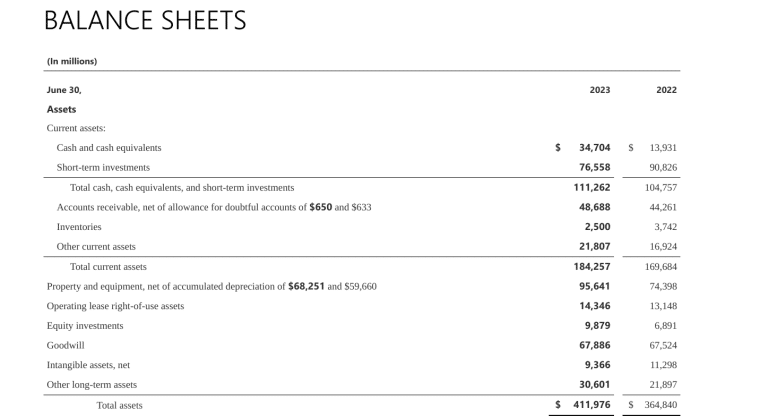
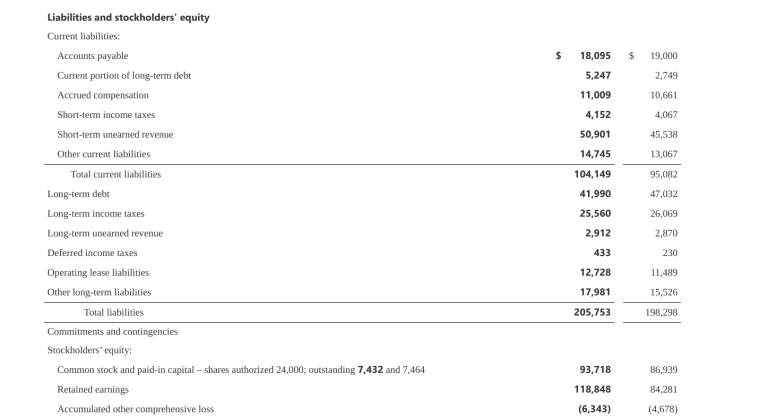
Using the price-to-book ratio formula, you complete the calculation:
Price-to-book ratio = (Market price per share/Book value per share)
The market price per share is the current stock price a company is listed for on the market, so $409.49.
To find the book value per the company’s assets minus liabilities divided by the total number of outstanding shares.
Which is: (411,976 million−205,753 million) / 7,432 million = 27.75
Then: $409.49 / 27.75 = 14.76
Analyzing and interpreting the results, you see it is consistent with the trend observed in technology companies, which is that Microsoft has a high P/B ratio of 14.76. A P/B ratio of 14.76 indicates that the market values Microsoft’s shares at nearly 15 times their book value.
This could be the case for several reasons. First, Microsoft is a tech company known for its valuable intangible assets. Secondly, the high P/B ratio reflects its strong brand value, high investor confidence, and positive expectations for future growth.
Example 2: Price-to-Book Ratio of a Company in the Banking Industry
Let’s consider Citigroup’s share information and gather financial data for 2023 as shown in the images below.
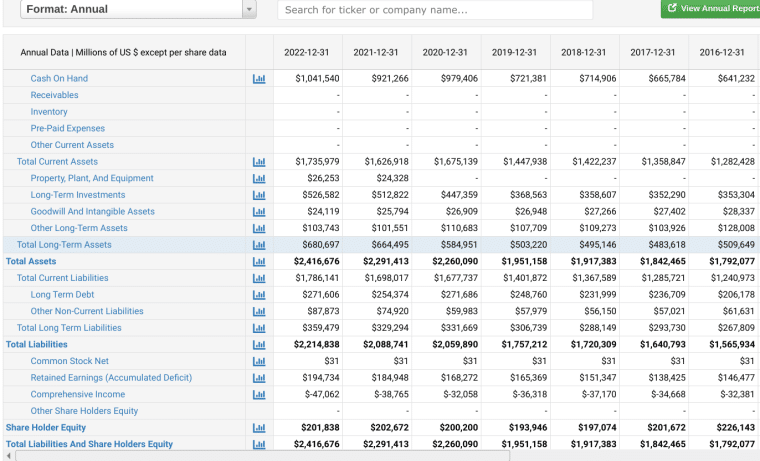
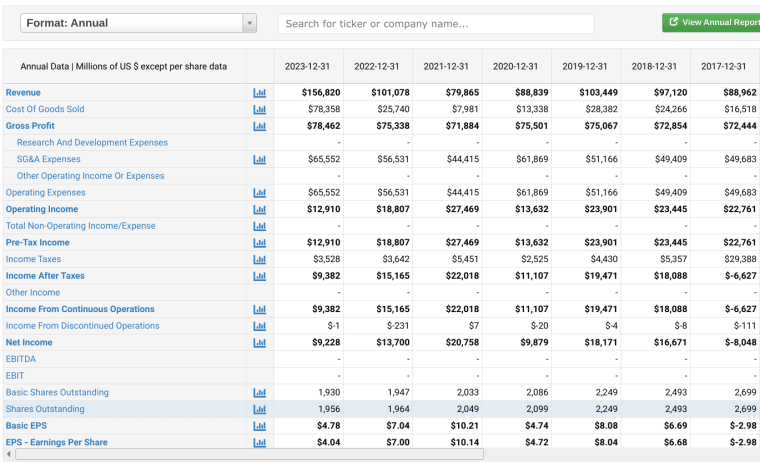
- Total assets: $2,416,676 million
- Total liabilities: $2,214,838 million
- Outstanding shares: 1.956 million
- Current stock price (as of February 14, 2024): $53.98
Using the price-to-book ratio formula, you complete the calculation like so:
Price-to-book ratio = (Market price per share/Book value per share)
The market price per share is the current stock price, so $53.98.
To find the book value per the company’s assets minus liabilities divided by the total number of outstanding shares.
Which is: (2,416,676 million – 2,214,838 million) / 1,956 million = 103.19
Then: $53.98 / 103.19 = 0.52
When you move on to analyzing and interpreting the results, you can see that the bank stocks are known to trade at prices below book value per share, even though revenue and earnings are on the rise (as is the case with Citigroup). The P/B ratio of approximately 0.52 indicates that the market values the bank’s shares at roughly half their book value.
This suggests that the stock is undervalued, offering a potentially attractive investment opportunity value to investors.
When to Use Price-to-Book Ratio
The price-to-book (P/B) ratio is particularly useful for assessing the value or investment potential of companies and in additional contexts such as:
Evaluating Companies Facing Profitability Problems
The P/B ratio helps evaluate companies that are experiencing fluctuating or negative earnings. For example, if a company isn’t profitable due to high growth investments (like most tech businesses), the P/B ratio provides an alternative measure of value to earnings-based metrics like the price-to-earnings (P/E) ratio.
Comparing Similar Stocks
When comparing two stocks with similar growth and profitability, the P/B ratio can be useful for pinpointing which offers better value at a particular point in time. For example, consider two technology firms that have similar profit margins. Suppose one has a P/B ratio of 1.5 while the other has a P/B ratio of 2.0.
The company with the lower P/B ratio may be considered more attractively valued relative to its book value, suggesting that it could be a better investment opportunity. Of course, you would need to do more research to make a better-informed decision using various other metrics like the Sortino ratio or liquidity ratios.
How to Adjust a Price-to-Book Ratio
Adjusting a price-to-book ratio for better outcomes is two-fold.
From a trader or investor perspective:
- Add context to your analysis by considering specific business, industry, and country benchmarks.
- Consider analyzing how a company’s price-to-book ratio has changed over time to spot trends and add more depth to your insights.
- Look at qualitative factors for a well-rounded understanding of a company’s market position.
From a company perspective — that is, if a company was looking to attract investment or if a business owner was looking to sell their company — the following adjustments could be made to positively influence the P/B ratio:
- Improve market perception to increase the stock price or investor confidence.
- Increase profitability to potentially increase book value.
- Reduce liabilities to increase net assets and improve book value.
Limitations of Price-to-Book Ratio
While it’s a valuable metric for evaluating investment opportunities, a price-to-book ratio has its limitations. For example, if a company has strong intangible assets such as intellectual property, brands, patents, or customer lists, it might have a higher P/B ratio that doesn’t fully reflect its value.
P/B ratios vary according to the industry and type of business, making cross-sector comparisons or generalizations difficult. Further, the price-to-book ratio is not an indicator of company profitability or cash flow.
To address these limitations, and for a more comprehensive understanding of the value of a company, calculate the P/B ratio alongside profitability ratios such as return on equity (ROE) and the price-to-earnings P/E ratio. These metrics will allow you to determine how efficiently a company is using its assets to generate profits and give you a better indication of performance. Also, consider running PEST analysis for market insights along with qualitative factors such as brand analysis or social sentiment analysis for well-balanced insights.

The Value of the Price-to-Book Ratio
In closing, the price-to-book ratio is a powerful financial metric for measuring a company’s current market value relative to its book value. The value of the price-to-book ratio lies in its simplicity and ability to highlight overvalued or undervalued stocks to drive more informed investment decisions.
You can leverage this metric to analyze stocks, determine company value, and compare similar investment opportunities. By doing so, you can be certain that you’re making more informed investment decisions that balance both risk and returns better.
As the P/B ratio doesn’t provide a complete picture of a company’s financial health or future performance prospects, it is essential that you combine your analysis with other factors and metrics. This may include profitability ratios, PEST analysis, and a qualitative evaluation for more balanced insights.

