A multivariate analysis observes the relationships between variables in easily readable formats so you can make inferences and informed business decisions. Using this tool correctly can lead to efficient resource allocation, more accurate forecasts, and a smoother production process.
Our team of experts at Business2Community has curated this complete guide to understanding and utilizing multivariate methods. Follow this guide and achieve the desired results for your business.
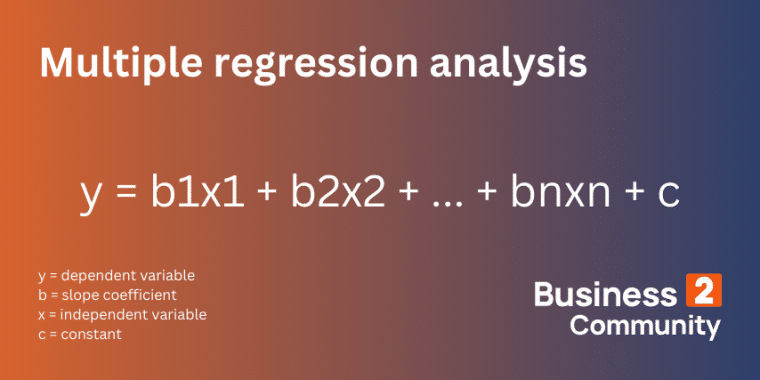
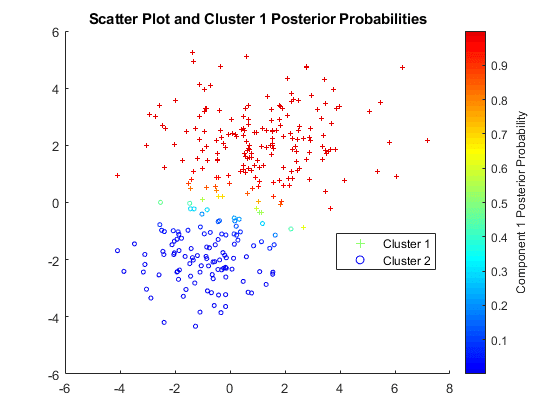
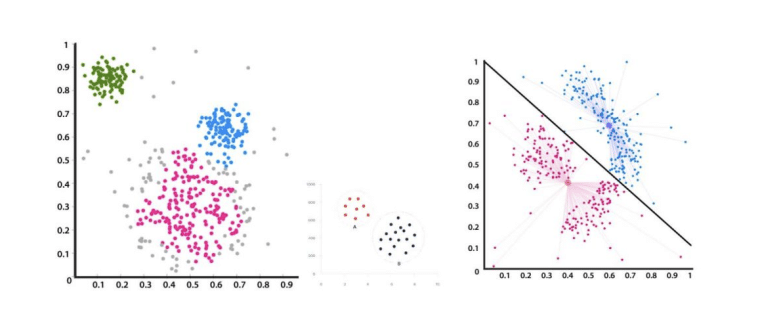
Multivariate analysis is a data analysis technique that examines the relationships among variables and the outcome. It looks into how various independent variables and dependent variables interact with each other to conclude their cause-and-effect relationships. For example, imagine you are a fitness instructor and want to find out factors that influence a person’s weight. Weight is the outcome variable you are interested in while factors like height, exercise levels, diet, and health levels are the independent or explanatory variables contributing to the outcome. In real life, there is usually more than one factor that impacts an outcome. A multivariate analysis helps your business to identify these variables to predict the future, minimize errors, and make more informed decisions. We’re going to look at how to utilize multivariate analysis to formulate the most profitable business strategies for your company. This factor analysis method is widely adopted by companies to dissect the correlations between multiple variables to understand how each business strategy could impact outcomes. By utilizing multivariate techniques, you can make smart decisions that minimize uncertainty and risks. A multivariate analysis is useful for adjusting prices, launching a new product, refining your business model, and many other corporate scenarios. It penetrates most spectrums of the business operations. As a decision-maker, you need to learn about these statistical techniques to nurture your company’s growth. Whether you are an entrepreneur, marketer, or data scientist, conducting the correlation analysis among the independent variables can significantly enhance your business performance. As their names suggest, a multivariate analysis and a univariate analysis differ in the number of independent variables they handle. A univariate analysis focuses on the relationship between one dependent variable and one independent variable, whereas a multivariate analysis studies the causation effects between the dependent variable and more than two variables. In theory, a univariate analysis is easier to carry out with only one simple, linear regression to consider. However, in real-life applications, a multiple linear regression model is often necessary because most outcomes are dictated by numerous factors, making multivariate methods more practical. Aside from these two-factor analysis methods, a bivariate analysis is also common. A bivariate analysis studies the relationships of two observed variables and the outcome. Now that we’ve covered the basic criteria of multivariate analysis, it’s time to dive into applying these multivariate techniques and how to interpret the multiple regression analysis results. Before we provide you with a step-by-step guide to conducting a multivariate analysis, let’s look at several dependence techniques you can use to conduct this analysis. We will look at three common multivariate analysis techniques involved in a dependence method, including a multiple regression analysis, a discriminant analysis, and a multivariate analysis of variance. Multiple regression analysis is the most common technique used to explore any possible relationships between variables. The formula is: With this technique, you can predict the value of an outcome with multiple factors with different linear combinations. It’s an extension of a simple regression equation with one linear combination. Discriminant analysis is another common technique that assigns variables to pre-classified groups that do not overlap. For example, if you want to predict which team member will deliver the highest sales volume in the next quarter, you need to plug in their work hours, qualifications, past sales results, etc. A discriminant function examines these variables that do not overlap but are vital to the outcome. To conduct a discriminant analysis, you will need more than two variables to observe. Also, multivariate analysis of variance (MANOVA) is another useful technique that measures how multiple independent variables can influence multiple dependent variables. Companies utilize this technique to predict the possible impact of different strategies on the outcomes like the improvements of services with a 3-month, 6-month, and 1-year training. You will need two or more response variables to construct a successful MANOVA model. These statistical techniques help create meaningful and easily readable data analysis results for statistics experts and decision-makers. The following steps will guide you to complete a full multivariate model to draw conclusions about all the independent variables that affect your desired outcome. The first step is to identify valuable data points and condense large data structures into a smaller set for easy extraction and interpretation. This technique is an important statistical procedure that sets the foundation for further analyses. You can use principal component analysis to distill crucial data. When simplifying the data sets, you need to make sure to retain all the valuable information. Grouping different variables based on their characteristics with a cluster analysis allows you to form meaningful linear regression models. You can use multiple measurements and trends to sort out the data. Data scientists rely on clearly separated data sets to create useful regression analyses. After sorting out the data points, the next step is to find the relationships among variables. Are some variables dependent on others? With regression analysis, you can map out relationships between dependent variables and independent variables and how they interact with each other. The purpose of multivariate data analysis is to place factors in a correlation matrix. The results will show you the magnitude of the impact made by different factors on the dependent variable. With the factor analysis regression models, you can make future predictions about the dependent variable when an independent variable changes or when multiple variables change. A multiple regression model is crucial for you to examine each factor and make inferences about the variables based on the observed data. Multivariate analysis allows data scientists to test theories about the relationships between the dependent variable and independent variables. With the multiple linear regression analysis, you can construct a null hypothesis test to determine if an assumption is of any statistical significance with controlled uncertainty. Once you decide on your hypotheses it’s time to test them directly. You may need to conduct multiple tests to determine the effects of more than one variable. Finally, use your results to better inform your business decisions. Businesses often conduct specific statistical hypotheses before launching a product and evaluating its effectiveness to better understand its market value. With a business-oriented focus, we’ve developed several real-life examples of multivariate analysis. These examples demonstrate how this technique can enhance your business’s efficiency. Let’s say you are the head of HR in an accounting firm in charge of formulating training courses for new hires. A multivariate analysis offers insights into key factors that can influence the outcome. Different variables like the duration of the program, assessment method, and the number of trainees in a class will all impact how well a candidate responds to the training program. With multivariate statistics, you can tell the magnitude of the influence of each variable on the outcome. The multivariable regression can predict the output level of an employee after receiving a particular amount of training. You can cross-examine the resources needed and possible results to distill down the most cost-effective training strategies. Cluster analysis is an incredibly useful correlation analysis tool for discovering relationships between variables. While certain correlations may seem obvious, there are a lot of factors with subtle relationships that can easily be missed without a cluster analysis. This method helps data scientists locate any underlying patterns that have previously been overlooked. Businesses mostly use cluster analysis to examine the scale of impact caused by different factors and if they should be more cautious when making changes to certain variables. Once you have composed a regression model using different multivariate measurements, you will have an idea of how each variable impacts sales. Using the regression line, you can predict the sales volume when a variable changes and set the corresponding production level to meet the target. Since a multivariate analysis is an intricate technique that requires lots of research and calculations, adjusting the results can be complicated. A change in the multiple logistic regression analysis or classification analysis will require a lengthy follow-up by updating the subsequent steps as well. Each step tightly follows the other and you can rarely make amendments to one without implicating the next steps. Although updating a multivariate analysis requires a lot of resources, you must get the most updated information about the dynamics among different variables. By studying how these elements interact with each other, your company can strategize accordingly. Multivariate analysis is certainly a powerful tool for identifying crucial elements that influence your business operations and decision-making in general. However, due to its complexity and lengthy process, there are quite a few limitations that you should keep in mind when conducting the analysis. To obtain meaningful results, you’ll need a large sample size of valuable data. Inadequate data points will lead to unreliable and biased results. With a huge target pool, it can be challenging for companies to sample a large enough population. If you don’t have enough resources, reducing the number of variables is another way to simplify the multivariate analysis to increase the accuracy rate. Carrying out a multivariate analysis can be a lengthy process that incurs tremendous research costs, especially for small firms without sufficient funding. Without support, firms will not be able to utilize the results and develop profitable strategies once the analysis is complete. Smaller firms can consider adopting simpler techniques like a PESTEL analysis and a break-even analysis to begin with, before moving on to more complicated calculations. This factor analysis tool requires statistical experts to decipher and interpret the results. Some cluster charts and regression models can be confusing for beginners. Firms may need to hire external help if no existing employees can facilitate the process. A multivariate analysis is a powerful data analysis technique that maps out the relationships between variables and how they impact your business. Conducting a thorough analysis can boost your business performance by predicting the corresponding sales and allocating resources to key factors. It is a challenging process – you will need to have a range of data that relates to the query you want to understand. While you may need to hire specialist staff or bring in an outside agency, it could be a smart move as your business processes develop in complexity. Unlike a univariate analysis and a bivariate analysis, a multivariate analysis looks into multiple variables at the same time, offering more in-depth guides into your business operations. Now, you can follow the steps above and create a multivariate analysis for your business.Multivariate Analysis – Key Takeaways
What is Multivariate Analysis?
Who Needs to Do a Multivariate Analysis?
Multivariate Analysis vs Univariate Analysis
How to Perform Your Multivariate Analysis
Multivariate Analysis Techniques

Step 1: Data Reduction in Multivariate Analysis
Step 2: Separate Variables into Groups

Step 3: Find the Relationships Among Variables
Step 4: Make a Prediction
Step 5: Construct a Hypothesis Test
Multivariate Analysis Examples
Example 1: Use Multivariate Analyses to Identify Cost-Effective Training Strategies
Example 2: Use Cluster Analysis to Identify Relationships Between Variables
Example 3: Use Multivariate Analysis to Predict Sales
How to Adjust a Multivariate Analysis
Limitations of Multivariate Analysis
It Requires a Large Database
It can be Expensive and Time-Consuming

You Need Experts to Interpret the Results
The Value of Multivariate Analysis
FAQs
What are examples of a multivariate analysis?
What are the three categories of multivariate analysis?
Is ANOVA a multivariate analysis?
What is an example of a multivariate analysis?

