In today’s competitive business environment, it’s crucial for decision-makers to make informed choices that lead to positive impacts on their organization. Employing valuable tools like multiple discriminant analysis (MDA) can help you discern patterns and correlations in your business data, enabling you to make better-informed, data-driven decisions.
In this guide, our experts at Business2Community are going to demystify this complex tool for you. We aim to empower you to implement this analytical technique in your own business operations, thereby driving your strategic decision-making process, and ultimately leading to improved business outcomes.
Multiple Discriminant Analysis – Key Takeaways
- Multiple discriminant analysis (MDA) is a statistical technique used to classify an observation into one of several a priori groupings depending on the individual’s measurements of several discriminant functions.
- Using MDA, you can make predictive decisions based on data, aiding in better understanding and segmentation of the target audience.
- Regularly using multiple discriminant analysis can help your business improve its strategic marketing and product placement decisions based on the classification of customer preferences and behavior.
What is a Multiple Discriminant Analysis?
Multiple discriminant analysis (MDA) is a quantitative method that classifies an object or event into one of several distinct categories based on its measurable characteristics. In the context of business, MDA is used to identify patterns and correlations that are present in data to enhance decision-making procedures.
MDA is a multivariate technique often used in marketing, finance, and other business fields to classify a set of observations into predefined classes. The purpose of MDA is to determine the features that discriminate between different classes, and so assisting you in more accurate and reliable decision-making.
Who Needs to Do a Multiple Discriminant Analysis?
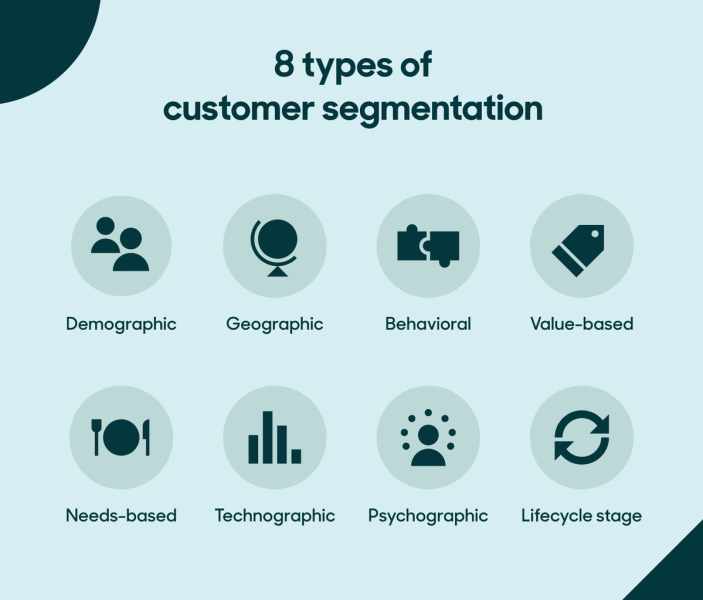
MDA can be beneficial across a wide array of scenarios. If you’re a new or expanding business, MDA can help you analyze and understand your customer base, enabling you to segment your market and target your products or services more effectively.

For a department within a business, such as the finance or marketing department, MDA can be used to classify and predict customer behavior, credit risk, or even the success of marketing campaigns based on past data.
Stock traders can leverage MDA to classify stocks into categories such as buy, hold, or sell, based on a range of financial indicators, thereby guiding their investment decisions.
Additionally, small and medium-sized business owners can use MDA to classify their products or services based on customer feedback, features, or price points to optimize their offerings and increase sales.
How to Perform a Multiple Discriminant Analysis
Performing a multiple discriminant analysis involves several specific steps, from data collection to interpretation of results. Here’s a simplified guide to help you navigate the process.
Step 1: Define the Problem and Collect Data
Start by clearly defining the problem you intend to solve using MDA. This could be classifying customers into different segments based on their purchasing habits, or predicting the success of a marketing campaign based on historical data.
Collect the necessary data relevant to your problem. Ensure that your data is accurate and comprehensive, as this will directly impact the reliability of your MDA.
Step 2: Preprocess Your Data
In this step, you need to clean your data by removing irrelevant information and handling missing data. You also need to normalize your numerical data to a standard scale to avoid any variable dominating the analysis due to its scale. This preprocessing stage is crucial for the quality and validity of your analysis.
Step 3: Conduct the Discriminant Analysis
Begin the actual analysis now. Using statistical software to conduct the MDA will prevent human error and reduce the time spent doing calculations. This software will calculate the discriminant function(s) based on your input data. The discriminant function is a linear combination of your independent variables that’ll provide the best discrimination between your groups.
Step 4: Determine the Significance
Check the statistical significance of your discriminant function(s) by looking at the Wilks’ Lambda statistic and the associated p-value. A significant result (usually a p-value less than 0.05) tells you that the discriminant function(s) are indeed useful in distinguishing between your groups. If it returns a high p-value it’s time to go back through and make sure no mistakes were made in data collection and the analysis itself. If you run it again and still receive a high p-value, the discriminant function will likely need to be reworked.
Step 5: Interpret the Results
Interpret the results by examining the group centroids (simply the vectors of means of the variables) and the discriminant function coefficients. The centroids give you the mean discriminant score for each group, while the coefficients tell you how much each variable contributes to the discrimination between groups.
When you have established your groups, you can move on to formulating strategies to engage with different segments of customers, manage risk, plan investments, and so on.
Examples of Multiple Discriminant Analysis
Let’s consider this entrepreneur named Jane, who offers a variety of fitness classes online, ranging from HIIT to yoga. She has collected data about her customers including age, gender, frequency of attendance, and preferred class type. Jane intends to use MDA to segment her customer base, with the aim of tailoring marketing strategies towards each segment.
Example Step 1: Define the Problem and Collect Data
Jane defines her problem: she wants to segment her customers into different groups based on their demographics and behaviors to know how best to engage with them.
The data she has collected include:
- Age
- Gender
- Frequency of attendance
- Preferred class type
Example Step 2: Preprocess the Data
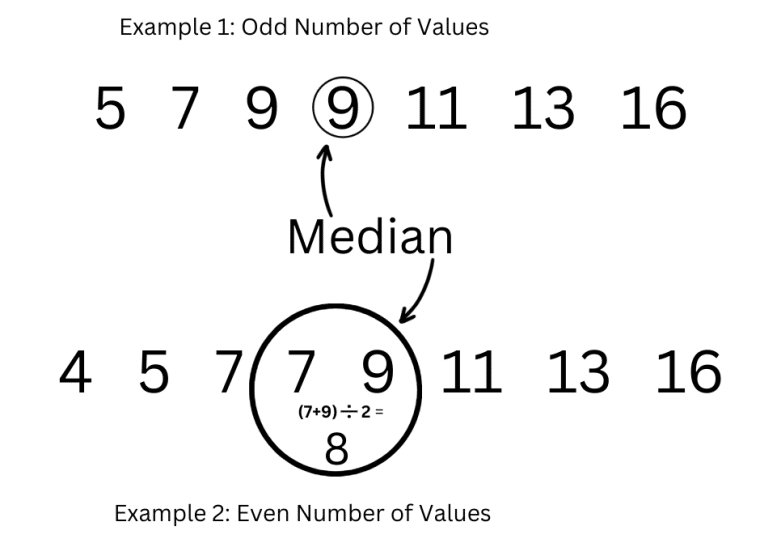
In this stage, Jane cleans her data. For instance, if she has inconsistent entries for gender like Male, M, or man, she standardizes them to one format. Also, if there is any missing data, such as a customer failing to specify their age, she decides on a strategy to handle these, perhaps by inputting the median age of the customers she has data for. For numerical data, like age and frequency of attendance, she normalizes them to a standard scale.

Example Step 3: Conduct the Discriminant Analysis
Jane uses statistical software, like SPSS or R, to conduct the MDA. Given her input data, the software calculates the discriminant function(s). For instance, the function could be 0.3 x age + 0.7 x frequency of attendance – 0.2 x gender (where gender is coded as 0 for male and 1 for female).
Example Step 4: Determine the Significance
Jane then checks the statistical significance of her discriminant function(s). The software provides her with the Wilks’ Lambda statistic and the associated p-value. Suppose her p-value was 0.03, this would be a significant result, suggesting that her discriminant function is indeed useful in distinguishing the differences between her customer groups.
Example Step 5: Interpret the Results
Lastly, Jane interprets the results. She examines the group centroids and the discriminant function coefficients provided by the software.
For instance, she might find that the yoga group has a mean discriminant score (centroid) of -0.2, and the HIIT group has a centroid of 0.5. This indicates that these two groups are distinct based on her variables. She could also see that the frequency of attendance has the highest coefficient, meaning that it contributes most to the discrimination between her customer groups.
From this, she can choose to work on improving how often people attend yoga classes with a strategy to show the long-term benefits of the practice, for example.

When to Use Multiple Discriminant Analysis
MDA can be effectively used in a multitude of scenarios. Here are two illustrative examples:
Example 1: Market Segmentation in Retail
A retail store might use MDA to segment their customers based on purchasing behavior, frequency of shopping, and the types of products bought. This analysis can help strategize personalized promotional offers and optimize store layout because you understand the wants and needs of different buyers in more detail.
Example 2: Credit Scoring in Banking
Banks often use MDA for credit scoring. Based on variables such as income, employment status, credit history, and age, they can predict the likelihood of a customer defaulting on a loan, thereby facilitating informed credit decision-making. You can apply this to your business if you choose to offer extended payment or BNPL options to manage the risk of non-payment.
How to Adjust a Multiple Discriminant Analysis
In real-world scenarios, business owners or traders can adjust their multiple discriminant analysis (MDA) by controlling various variables. Here are some examples of how these variables can be manipulated to improve outcomes:
- Changing pricing: Adjusting the price of a product or service can affect its demand, and subsequently, its classification in the MDA. For instance, a decrease in price might attract a new segment of customers, shifting the discriminant point.
- Modifying overheads: Altering the overhead costs associated with a product or service can change its profitability, affecting its categorization within the MDA. Cutting unnecessary expenses, for example, might make a product more profitable and reposition it within the analysis.
- Introducing new products or services: The addition of a new product or service can shift the existing discriminant points, as it introduces a new variable into the mix. The success or failure of this new offering would need to be integrated into any future MDA.
- Changing marketing strategies: Tweaking advertising and promotional strategies can attract different customer segments or change customer behavior, which influences the MDA. A successful marketing campaign can lead to increased sales and a shift in the discriminant point related to customer behavior.
- Adapting to market trends: Being responsive to market trends and shifts can also affect the MDA. This can include anything from technological advancements to changes in consumer behavior or preferences.
Limitations of Multiple Discriminant Analysis
While multiple discriminant analysis (MDA) can be a powerful analytical tool, like any statistical method, it does have its limitations. MDA:
- Assumes the variances of the different groups to be equal (homogeneity of variances). Violation of this assumption can adversely affect the accuracy of the analysis.
- Is sensitive to outliers and high leverage points, which can distort the discrimination process.
- Assumes that the independent variables are linearly related to the discriminant function. If this linearity assumption is violated, the discriminant function may not accurately classify the groups – if there isn’t a direct link between data, your groupings may not be accurate.
- Is a parametric procedure, requiring the data to be normally distributed. Violations of normality can render the results of the MDA unreliable – having outliers in your data can make grouping things together harder to get right.
To enhance the results and understanding of the MDA, it is beneficial to perform other statistical analyses, such as a PEST analysis or PESTEL analysis to identify external factors that may impact the discriminant function.
The Value of Multiple Discriminant Analysis
The application of multiple discriminant analysis (MDA) in business operations and decision-making processes can be instrumental in achieving maximal business success. It can provide your business with invaluable insights into its customer base, helping you to segment and understand your audience better so you can target each type of customer better.
By identifying patterns and relationships within complex data sets, MDA enables your business to predict customer behavior and preferences, leading to better-targeted marketing strategies and more efficient allocation of resources.
Combining MDA with other statistical methods can help validate these assumptions, enhance the robustness of the analysis, and provide a more comprehensive understanding of the data. Therefore, businesses should not view MDA as a standalone solution but as part of a broader suite of analytical tools that when used together, can contribute significantly to their success.
