Inferential statistics allow researchers to make meaningful estimations about their entire targeted population without sampling everyone. It quantifies the unknown and uncertainty, so you can easily interpret these numbers for your business.
Whether you’re doing market research for your product or learning about statistics, here at Business2Community, we’re going to cover how quantitative analysis can help you build a profitable business model.
Then we will go over real-life inferential statistics examples that show how you can use them to your benefit.
Key Takeaways:
- Essential for Decision Making: Inferential statistics is crucial for making educated guesses about a larger population based on a representative data sample.
- Types of Inferential Statistics: Includes hypothesis tests, which assess if results are by chance, and regression analysis, which explores causation effects between variables.
- Foundation in Research and Development: A cornerstone for business R&D, allowing companies to estimate product demand and effects without surveying the entire customer base.
- Hypothesis Testing: This method tests assumptions about population parameters, helping determine if observed differences are statistically significant.
- Regression Analysis: Analyzes the relationship between dependent and independent variables to predict outcomes, crucial for business modeling and demand forecasting.
- Complementing Descriptive Statistics: Inferential statistics, coupled with descriptive statistics, provides a comprehensive analysis, enhancing understanding of data trends and facilitating future predictions.
- Applications in Business: From predicting future sales and conducting quality control to managing uncertainties, inferential statistics informs various strategic business decisions.
- Setting Confidence Intervals: Adjusting confidence intervals helps quantify risks and uncertainties, balancing research costs against the level of precision needed for business insights.
- Practical Examples: Real-life examples illustrate how businesses use inferential statistics to estimate product demand, ensure quality control, and make informed decisions under uncertainty.
- Cost-Effective Strategy: By analyzing representative samples, inferential statistics offers a reliable and economical approach to understanding larger populations, critical for business planning and optimization.
What Is Inferential Statistics?
Inferential statistics studies the behavior of representative data and makes inferences about the larger population through analysis.
In the business world, inferential statistics are an inseparable part of the R&D process. Companies want to estimate the demand and effects of products, but collecting data from the whole desired pool of customers or clients is almost impossible.
Since inferential statistics predict the characteristics of the population through data analysis, it’s a reliable and cost-effective way to make informed decisions. If you’re a business student, it will be one of the first things you learn to better understand the numbers you’re working with.
The two types of inferential statistics are:
- Hypothesis tests – Did the results happen by chance?
- Regression analysis – What are the causation effects between variables, if any?
Before we move on to the specifics, it’s important to understand why we need these techniques. Just like all predictions, inferential statistics offer highly educated guesses that may – or may not – be true. These methods provide estimations with a higher probability of matching your business’ reality.
Hypothesis Tests
Hypothesis testing is a method of statistical inference used to test your assumptions about population parameters. It determines if the differences observed are statistically significant.
Here’s an example. After administering a new drug to physically disabled patients, you record an increase in limb movements compared to patients taking the original drug. This is when a hypothesis test comes in handy. The results will inform you if the differences are a coincidence.
To obtain valid test results, these are three common assumptions researchers set for hypothesis testing:
- The population follows a normal distribution.
- The data sampled are completely random.
- The data have the same variances.
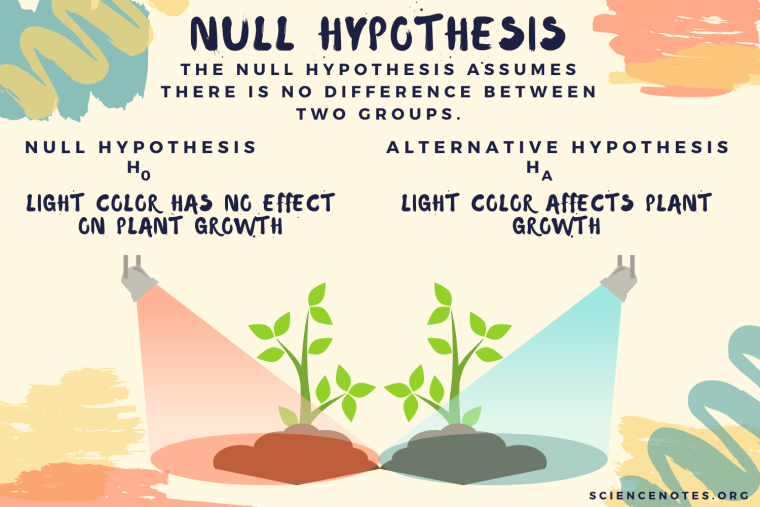
A null hypothesis (H0) and an alternative hypothesis (Ha or H1) are set. The null hypothesis states no significant relationship between the sample mean and the population mean – the differences observed are simply due to chance.

H0 : µ = µ0
Ha : µ ≠ µ0 / µ < µ0 / µ > µ0
Depending on the Ha, a hypothesis test can be two-tailed, left-tailed, or right-tailed.
T tests and z tests are the two main types of hypothesis tests. A t test is used when the sample size is less than 30 whereas a z test is used when the sample size is 30 or above.
t = (X̄ – μ) / (s/√n)
z = (X̄ – μ) / (σ/√n)
These are the symbols that you need to know in a hypothesis test:
| Symbol | Meaning |
| μ | Population mean |
| X̄ | Sample mean |
| n | Sample size |
| df | Degree of freedom |
| σ | Population standard deviation |
| s | Sample standard deviation |
| α | Significance level (When this is not given, 0.05 is typically assumed) |
If the test result falls beyond the critical value into the rejection zone, you can reject H0. The results are extreme and significant. Otherwise, you fail to reject H0. There is not enough evidence that the results are significant.
In real-world applications, you will most likely be trying to reject H0 to prove your point.
For example, you may want to show that an energy drink can bring up exam scores for university students. Your H0 will assume no significant differences between the sample mean and population mean, i.e. the product does not work. The Ha assumes the sample mean to be significantly higher than the population mean.
If you can reject H0, you are confident enough to say that the product can effectively improve exam performances.
Regression Analysis
Regression analysis breaks down the causation effects between variables so you can predict possible outcomes when one variable changes. This method is useful in curating business models and forecasting demands in different situations.
The two types of variables are:
- Dependent variable – The factor/outcome you are trying to predict/understand.
- Independent variable – The factor you think may have an impact on the dependent variable.
Let’s say you’re interested in knowing how rainy days (independent variable) impact the sales (dependent variable) of your umbrella business. To draw valid conclusions, you must first collect data from the past.
Plot the data points on a chart. The y-axis denotes the number of sales and the x-axis denotes the rainfall level on a business day. In regression analysis, the dependent variable will always lie on the y-axis.
Once you have all the data points on the chart, a regression line will be drawn. A regression line is a line that goes through the center of the scattered dots, which offers the most reliable estimation of the correlation between the two variables.
Depending on the numbers, a regression line formula will be something like:
y = 200 + 3x + error term
The error term explains how the prediction may deviate from reality. For a simpler illustration, we don’t have to worry about this and can assume the error term to be 0.
The formula tells you that on any given business day with zero rainfall, you will still sell 200 units of umbrellas. When the rainfall level increases by 1 inch, the sales triple.
Descriptive vs Inferential Statistics
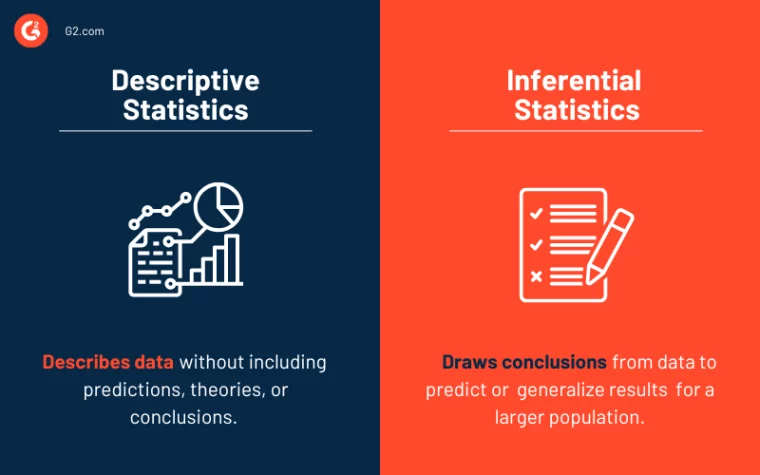
Descriptive statistics describes and summarizes data characteristics while inferential statistics uses sample sets to make inferences about the whole population. The main difference between descriptive and inferential statistics is that the former is completely factual without any unsureness while the latter will always involve a certain degree of uncertainty.
Here’s a summary of descriptive vs inferential statistics:
| Descriptive Statistics | Inferential Statistics | |
| Purpose | Describe data observed and collected to understand its characteristics and trends. | Analyze sample sets to predict how the population will behave. |
| Types | Descriptive analytics Diagnostic analytics Predictive analytics Prescriptive analytics |
Hypothesis tests Regression analysis |
| Certainty | No uncertainty | With uncertainty |
| Sample Collection | Must sample everyone in the population. | Sample a random set in the desired pool. |
The same sample set can be used for both descriptive and inferential statistics analyses. They complement each other in the quantitative research process.
For example, you can make great use of your sales records for the past three years. With descriptive statistics, you can draw conclusions (e.g. March always generated the most sales). With inferential statistics, you can estimate next year’s performance.
Examples of Descriptive Statistics
In essence, descriptive statistics quantitatively explains information about massive data sets so we can make sense of these numbers. It connects the dots and presents data points in a meaningful way.
These are the three main things descriptive statistics can tell us:
- The central tendency – What are the mean and the median of the data set?
- The distribution – Where are most of the data points?
- The variability – How spread out are these numbers?
Say you’re offering business coaching services, you can find out the most popular course, the income distribution of your clients, average spending on your services, and more. The data builds a detailed look into your accounts so you can construct your business model around it.
Inferential Statistics Examples
After learning about the definitions and types of inferential statistics, it’s time to dive into its applications to see what role it plays in the business world. Here are 3 different ways you can utilize this quantitative analysis technique:
- Predict future sales
- Quality control
- Manage the uncertainty
We’ll take a deeper look at these examples to see how this research method shapes our business world.
1. Predict Future Sales
Let’s assume that you manufacture thermal socks and are interested in knowing when to adjust the production level to save costs. After creating a regression analysis model, you’ve discovered a negative correlation between the temperature and sales.
Your regression line formula is:
y = 500 – 10x
Let’s say the base temperature is 32°F. For every degree (°F) that goes up, the sales drop by 10 times. Once the temperature increases by 50°F, the sales drop to zero. Since you can’t sell negative units, you can expect zero purchases after it reaches 82°F (32°F + 50°F).
Using inferential statistics, you can estimate the demand for your products during the hotter and colder months so that you know what times are best for certain products and build a product strategy accordingly.
2. Quality Control
An electric toothbrush company claims that its best-selling model can last for 3 years on average, and you want to see if it’s true. Your best option is to survey a random group of existing clients and conduct a hypothesis test.
H0 : µ = 3
Ha : µ ≠ 3
If you can reject H0, the company may need to look into its product descriptions and update the product’s specifications with research.
Inferential statistics is regularly used in the quality control process, especially for businesses that engage in mass production. It gives companies a clearer idea of how their products live up to expectations and how they can improve the experience for customers.
3. Manage the Uncertainty
Setting an appropriate confidence interval (CI) is the best way to quantify the risk you’re taking in the analysis of quantitative data. A 95% CI means that if you repeat the hypothesis test 100 times with a different random sample set, the results should fall within a certain range 95% of the time.
Some industries, like pharmaceutical companies, may want to be prudent and set a higher CI. It makes H0 harder to reject and may incur more research costs. Depending on your business needs, a suitable CI should balance the research costs and the level of uncertainty.

