Through the lens of horizontal analysis, businesses can spot trends or growth patterns in their financial performance, unlocking useful insights to drive success. Whether you’re a business owner, manager, or investor, horizontal analysis is an indispensable technique for revealing financial health over time and making informed, data-driven decisions.
To help you leverage this valuable financial analysis tool, we use our expertise at Business2Community to guide you through everything you need to know, including how to perform horizontal analysis, its key use cases, and examples of the process in action.
Horizontal Analysis – Key Takeaways
- Horizontal analysis helps track changes in a company’s financial metrics over a specified period.
- By comparing financial data, horizontal analysis empowers stakeholders with the insights to inform decision-making and remain competitive over the long term.
- Consistently performing horizontal analysis, and combining it with other strategic analysis tools like ratio analysis, vertical analysis, and PESTEL helps businesses respond to evolving market conditions.
What Is Horizontal Analysis?
Horizontal analysis is a quantitative method used to compare historical data, such as line items and ratios from your company’s financial statements over a series of accounting periods. It is called horizontal analysis because it looks down your accounts and balance sheet horizontally.
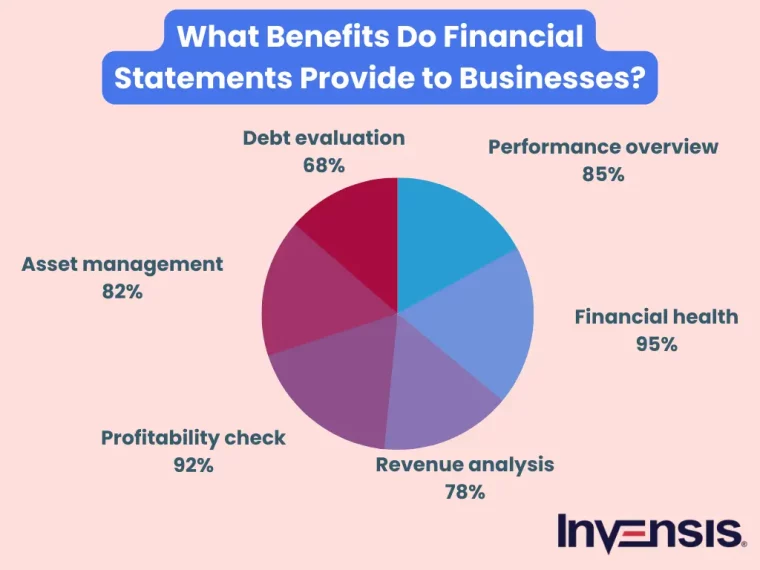
By comparing figures from the balance sheet and income statement, horizontal analysis reveals changes and trends over time, allowing stakeholders to evaluate your company’s financial health, growth, and profitability.
Who Needs to Conduct a Horizontal Analysis?
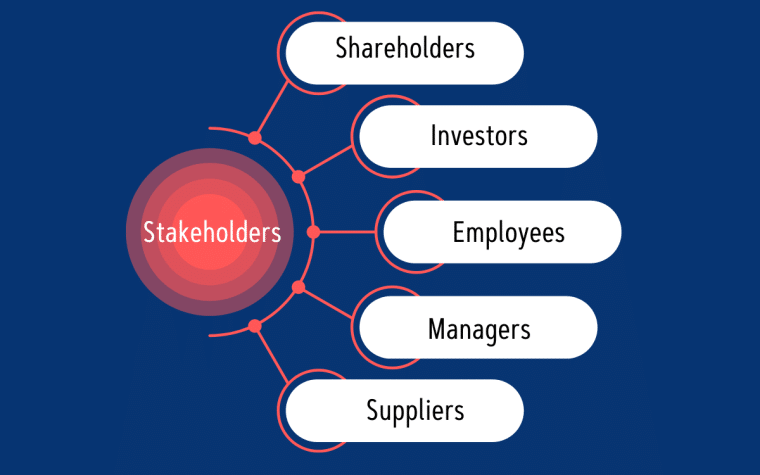
Anyone interested in understanding the financial performance of a company over a period of time would need to do a horizontal analysis. This includes key stakeholders such as business owners, shareholders, management teams, business consultants, investors, lenders, and competitors.
Stakeholders can leverage the insights gained from this financial analysis technique to:
- Evaluate business performance and compare growth rates.
- Identify areas of opportunity or concern.
- Allocate resources optimally.
- Spot growth and profitability trends.
- Project historical trends into the future.
- Make informed decisions related to their respective roles.
For example:
- Business owners and management teams – Horizontal analysis allows business owners and management teams to track their company’s performance and make informed decisions about operations, resources, and future investments.
- Shareholders, investors, and stock traders – You can use horizontal analysis to assess a company’s growth and profitability over a specific period. By analyzing a company’s financial statements in this manner, shareholders and investors can identify trends in revenue growth or profitability, leading to more informed investment decisions.
- Lenders and credit analysts – A horizontal analysis reveals a company’s financial stability and its ability to meet its financial obligations. By analyzing trends in financial metrics such as solvency and coverage ratios, the risk associated with lending to a particular company can be accurately evaluated.
- Competitors – Competitors can use horizontal analysis to benchmark their performance or financial position versus competitors in the same industry. By comparing financial trends, growth rates, and more, best practices, or key areas of improvement can be identified.
Horizontal Analysis Use Cases
Horizontal analysis has an array of use cases, such as evaluating business performance, identifying sales trends, informing investment decisions, forecasting future growth rates, and more.
Evaluating Business Performance
Your company can use horizontal analysis on its five-year financial data, looking at growth rates from year to year. If the analysis shows a drop in revenue growth, with operating expenses increasing more quickly than revenues, your management team may decide to adopt strategies to improve growth and control costs.
Identifying Sales Trends
As a small business owner, you might apply horizontal analysis to your sales data, comparing quarter-over-quarter or season-over-season performance over several years. Let’s say the analysis uncovers significant seasonal variances in sales, with certain quarters consistently outperforming others. This insight allows you to adjust your marketing or inventory strategies and improve overall sales performance.

Informing Investment Decisions
As an investor you may need to decide between two startups so conduct a horizontal analysis to compare their financial performance over three years. By comparing year-over-year changes in income statement data like revenue, profit margins, and operating expenses, you can make a more informed investment decision.
Forecasting a Company’s Financial Performance
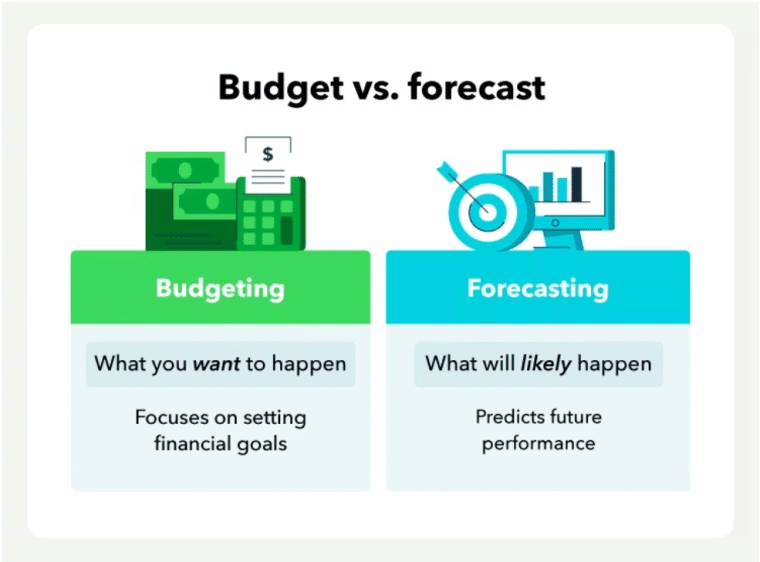
Your company can leverage horizontal analysis to forecast its future performance. Historical data comparisons from the income statement and balance sheet allow your company to identify trends in metrics such as net sales, gross profit, or net income over five years. This, in turn, helps with budgeting, allocating resources, and more effective planning.
How to Perform a Horizontal Analysis
Performing horizontal analysis involves the following steps:
- Step 1: Gather financial data.
- Step 2: Use the horizontal analysis formula.
- Step 3: Analyze and interpret the results.
- Step 4: Benchmark your performance.
Let’s look at each step in greater detail below:
Step 1: Gather Financial Data
Start by gathering financial data for the periods you want to analyze from income statements, balance sheets, or cash flow statements. To maintain accuracy and comparability:
- Ensure accounting methods are consistent across different reporting periods.
- Compare equivalent time periods to avoid misinterpretation.
- Consider adjusting financial data for inflation for comparisons over several years.
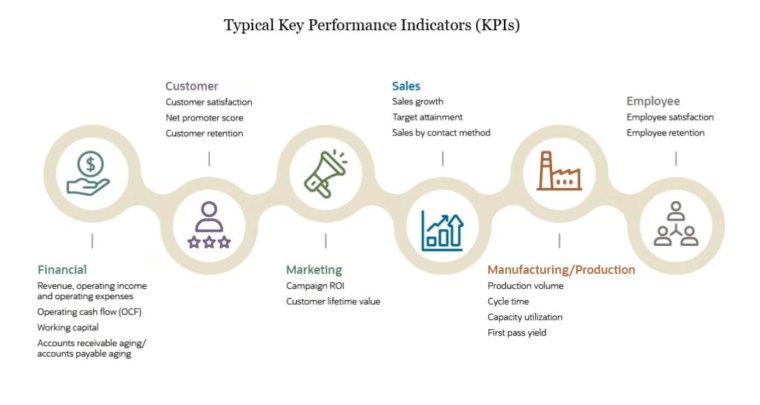
Horizontal analysis can be performed on any financial statement metric, financial ratio, or financial statement line item over a specified accounting period. However, consider evaluating key performance metrics such as profit margins, revenues, or turnover rates over multiple periods to identify opportunities or concerns.
Step 2: Use the Horizontal Analysis Formula
Once you have all your financial data ready, identify a line item, ratio, balance, or any other metric you would like to analyze. Then, select your base period. This can be a month, quarter, or year. Thereafter, choose your comparison periods.
The horizontal analysis formula compares comparison years to a base year to identify trends in financial data. There are two primary calculations you can use to conduct a horizontal analysis. Namely the absolute change formula and the percentage change formula.
The Absolute Change Formula
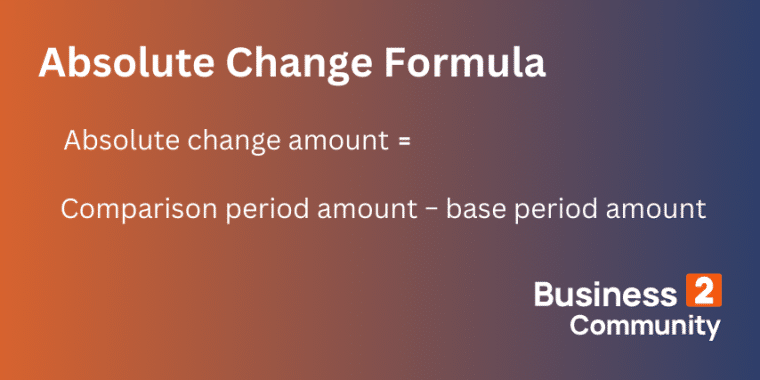
The absolute change method calculates the difference between the amount in the comparison year and the amount in the base year. It is beneficial for quickly assessing the actual dollar amount of change in a financial metric.
The formula is:
Comparison Period Amount − Base Period Amount = Absolute Change Amount
The Percentage Change Formula
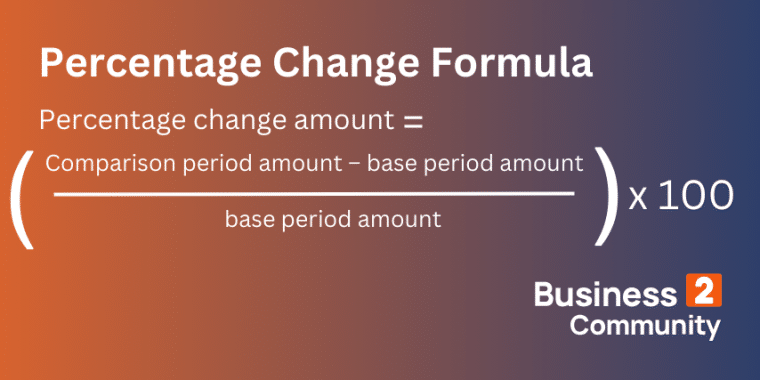
The percentage method measures the relative change in a financial metric over time as a percentage. It is calculated by subtracting the base period amount from the comparison period amount, dividing the difference by the base period amount, and multiplying by 100.
By expressing changes in percentage form, this horizontal analysis calculator offers a more meaningful way to measure and communicate financial performance.
The formula is:
(Comparison Period Amount – Base Period Amount/ Base Period Amount) x 100 = Percentage Change Amount
Step 3: Analyze and Interpret Results
Identify any significant shifts, patterns, or trends in the metrics you’ve chosen to analyze. Pay particular attention to significant increases or decreases in specific line items such as revenue or operating expenses and assess their impact on your company’s overall financial health.
Key questions to ask include:
- Are there any major positive or negative changes? In what areas?
- Are profit margins increasing or decreasing over time?
- How is the business managing its debt obligations and expenses?
- How do sales revenues compare to the previous quarter?
- Are account balances positive, and does the business have adequate liquidity?
With thorough analysis and interpretation, positive trends can be identified while negative trends can be mitigated.
Step 4: Benchmark Performance
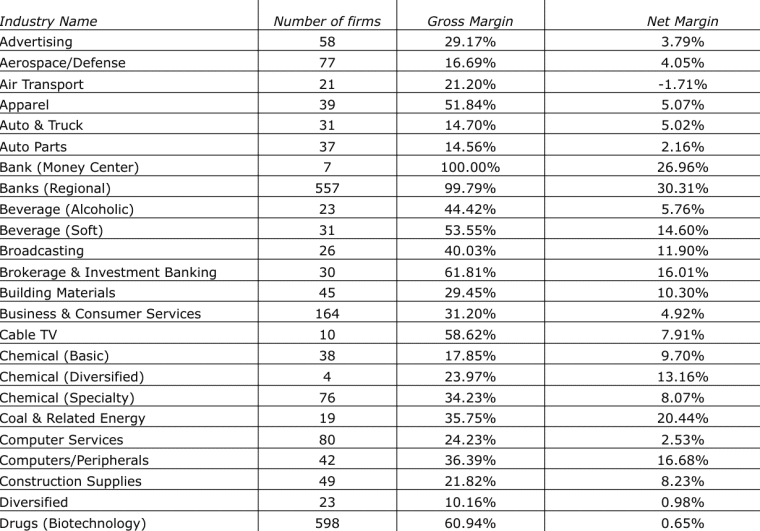
For even deeper insight into your company’s performance, benchmark your financial results against industry averages or key competitors. For example, the NYU Stern School of Business reports that the average net margin is 8.89%, however, this varies across industries. Check the 2023 Margins by sector list to explore key industry averages.
Examples of Horizontal Analysis
Below, we explore two examples of horizontal analysis that you can use to evaluate your company’s revenue and profitability.
Example 1: Profit Margin Analysis
A company’s gross profit margins for five years are as follows:
- Year 1: 15% (Base Year)
- Year 2: 17%
- Year 3: 23%
- Year 4: 27%
- Year 5: 30%
As these values are already in percentage form, let’s perform a horizontal analysis using the absolute change formula:
Comparison Period Amount − Base Period Amount = Absolute Change Amount
Year 2 compared to the base year:
17% – 15% = 2%
Profitability increased by 2%
Year 3 compared to the base year:
20% – 15% = 5%
Profitability increased by 5%.
Year 4 compared to the base year:
25% – 15% = 10%
Profitability increased by 10%.
Year 5 compared to the base year:
30% – 15% = 15%
Profitability increased by 15%.
From the analysis, there is a clear upward trend in the company’s profitability over time.

Example 2: Revenue Analysis
A company has the following revenue totals over 4 years.
- Year 1: $100,000
- Year 2: $120,000
- Year 3: $150,000
- Year 4: $180,000
Let’s perform a horizontal analysis using the percentage change formula:
(Comparison Period Amount – Base Period Amount/Base Period Amount) x 100 = Percentage Change Amount
Year 2 compared to the base year:
($120,000 – $100,000/$100,000) x 100 = 20%
Revenue increased by 20%
Year 3 compared to the base year:
($150,000 – $100,000/$100,000) x 100 = 50%
Revenue increased by 50%.
Year 4 compared to the base year:
($180,000 – $100,000/$100,000) x 100 = 80%
Revenue increased by 80%.
The analysis shows an increase in revenue each year, highlighting positive growth over time.
How to Adjust a Horizontal Analysis
To conduct an effective horizontal analysis, it is essential to base your assessment on accurate financial data. This is best achieved by following established accounting standards and procedures, as well as using reliable accounting software. These measures ensure that your financial records are not only consistent but also free from errors, providing a solid foundation for your analysis.
To adjust your horizontal analysis:
- Identify key business areas that require improvement and investment.
- Regularly review and update your business strategies, processes, and practices to ensure they are in line with current market trends and industry standards.
- Develop and enhance proven revenue generation and cost management strategies to keep operational expenses low while improving profitability over time.
Limitations of Horizontal Analysis
While a horizontal analysis allows you to evaluate a company’s past performance and current financial position, the technique has limitations. Notably, if there are significant changes in your business structure (such as mergers or acquisitions), your financial data may not be comparable across periods.
Limited Financial Perspective
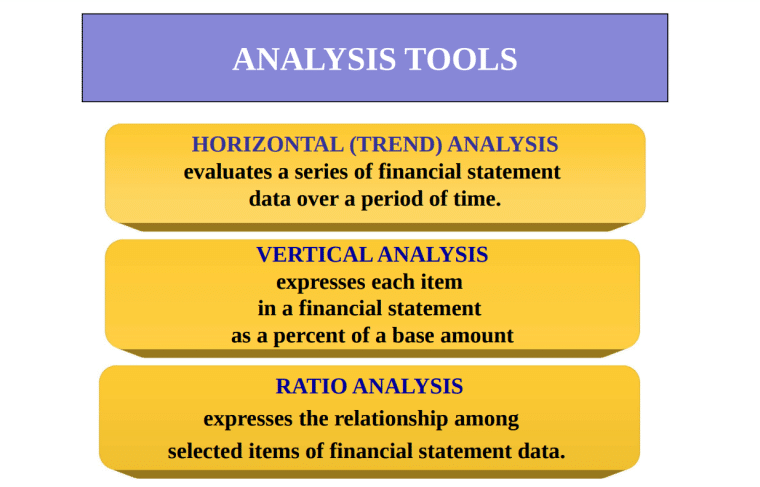
Horizontal analysis compares financial changes over time, providing a limited view of a company’s financial position. For a more comprehensive understanding of financial performance, combine horizontal analysis with ratio analysis and vertical analysis. Vertical analysis shows how each line item in the financial statement contributes to overall performance, while ratio analysis analyzes the relationship between different financial variables.
Internal Focus
Horizontal analysis doesn’t consider external factors like economic conditions, industry trends, or regulatory changes that can have a significant impact on financial results. And while it highlights changes over time, it can’t explain the reasons behind these changes.
Additional analysis is required to understand the reasons behind any changes. As such, horizontal analysis is best combined with other strategic frameworks like PESTEL or SWOT for a better understanding of business opportunities and threats.
The Value of Horizontal Analysis
In a fiercely competitive business landscape, horizontal analysis is essential for identifying trends in financial performance and staying ahead of the curve. It reveals trends, emerging opportunities, and potential threats in key financial areas like profitability and liquidity. This empowers data-driven decision-making, allowing stakeholders to capitalize on opportunities while mitigating risks.
Ultimately, adding horizontal analysis to your business intelligence efforts is the key to ensuring long-term financial health and success. Integrate it with vertical analysis, ratio analysis, industry benchmarking, and other strategic planning frameworks like PESTEL to unlock even more powerful insights.
