What started as a private network for college students has become a worldwide phenomenon boasting an impressive 2.963 billion users. Facebook, owned by Meta (Formerly Facebook Inc.) is the social network to rival all others.
Exploring everything that makes this social network tick is no easy feat, which is why we’ve put together the ultimate list of over 90 Facebook statistics. Read on to discover all you need to know about Facebook’s history, revenue, products, and more.
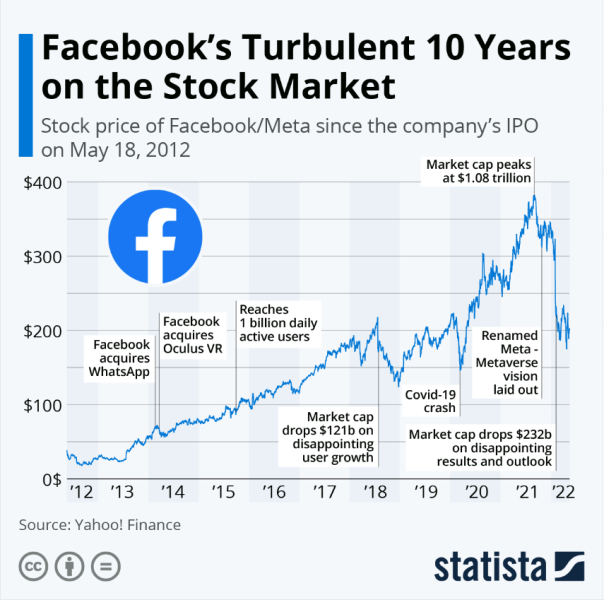
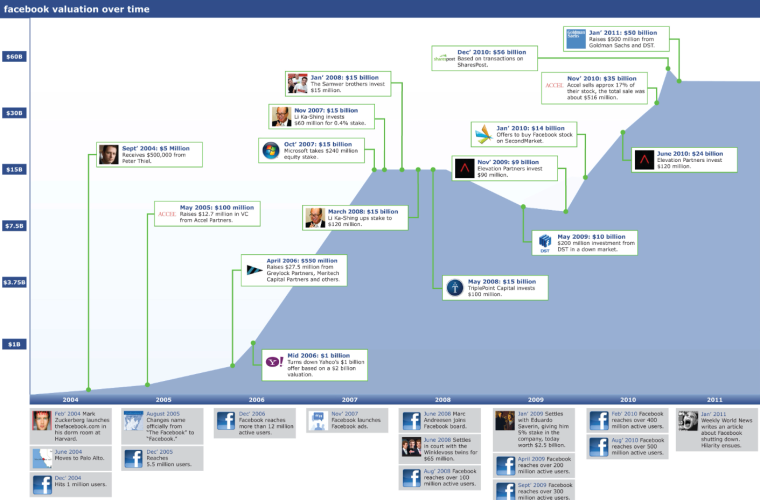
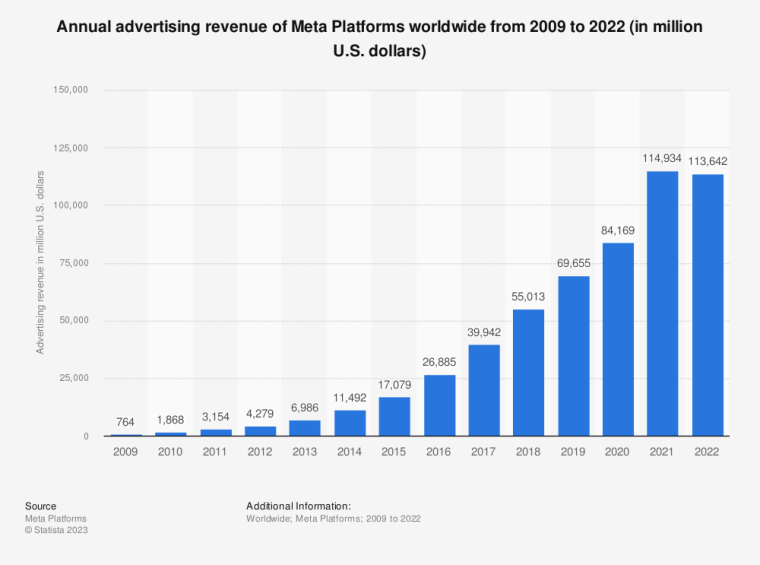
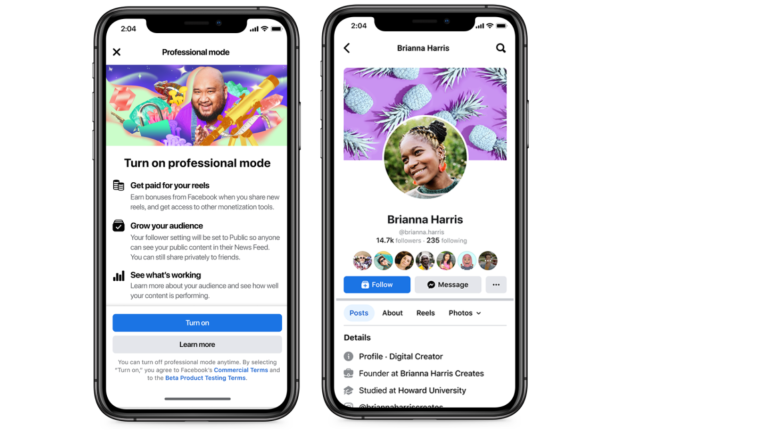
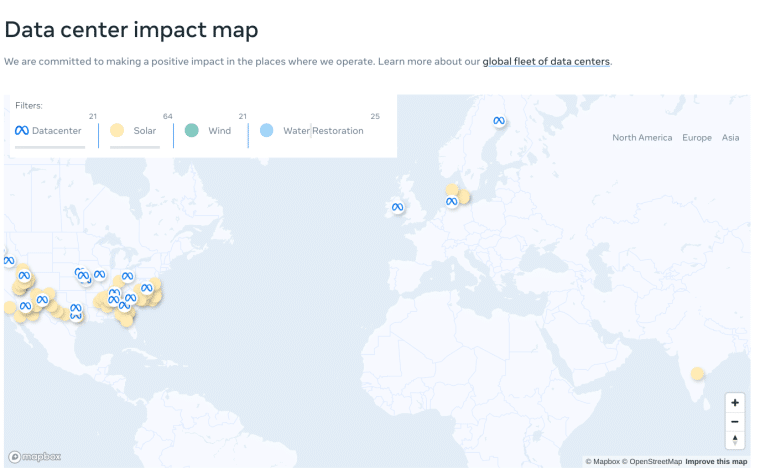
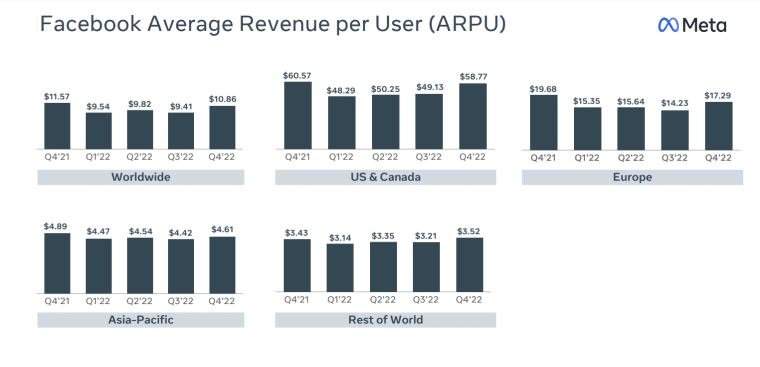
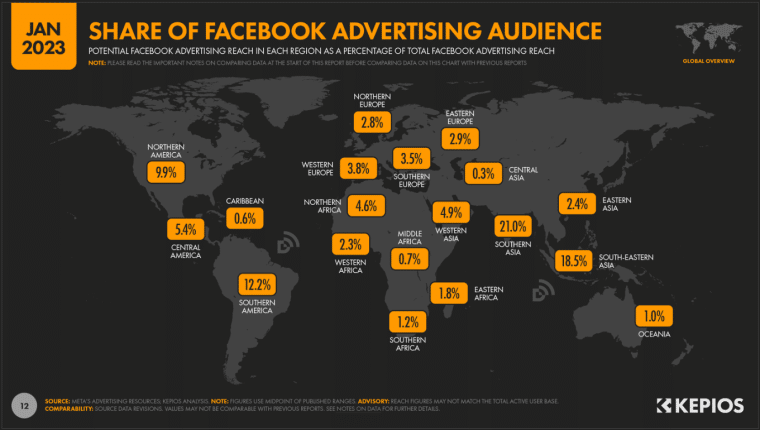
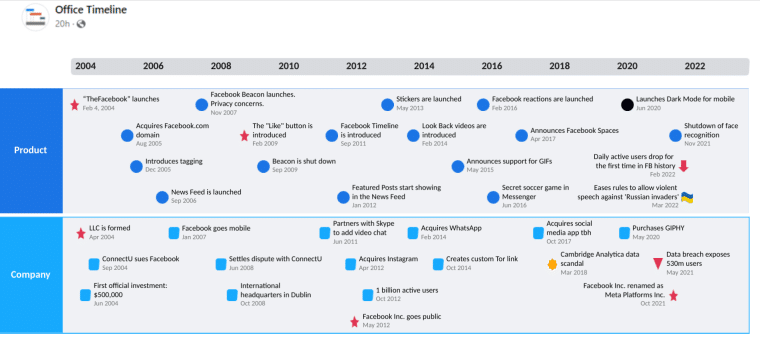
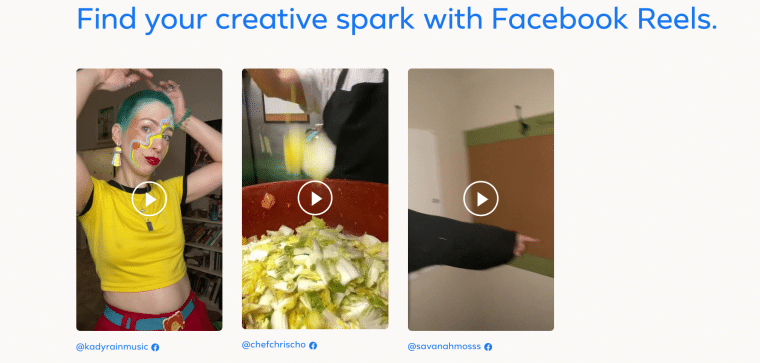
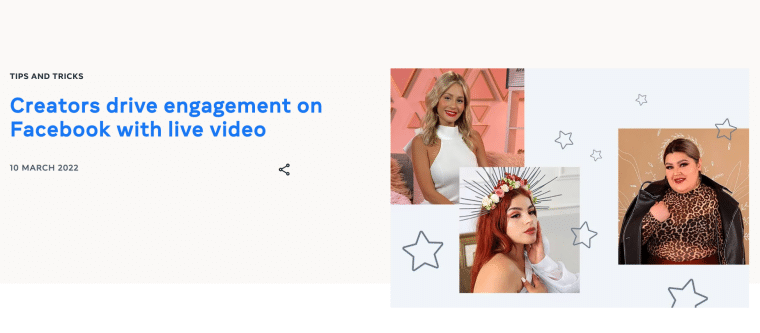
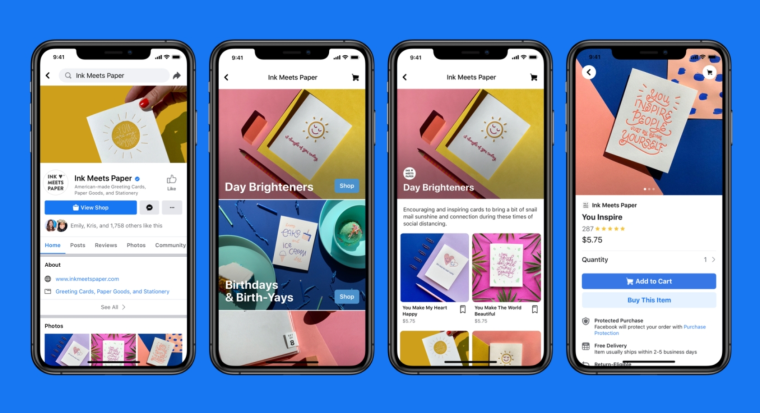
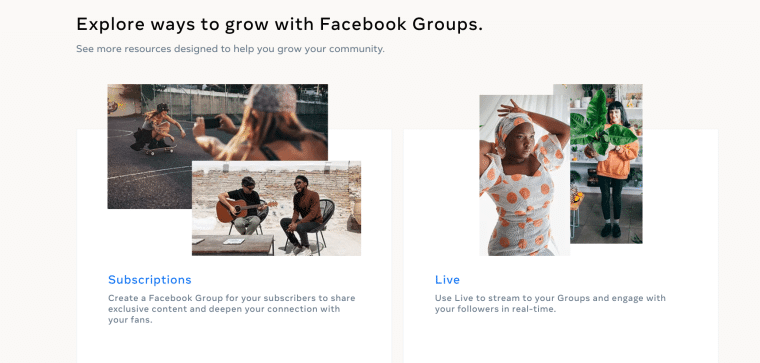
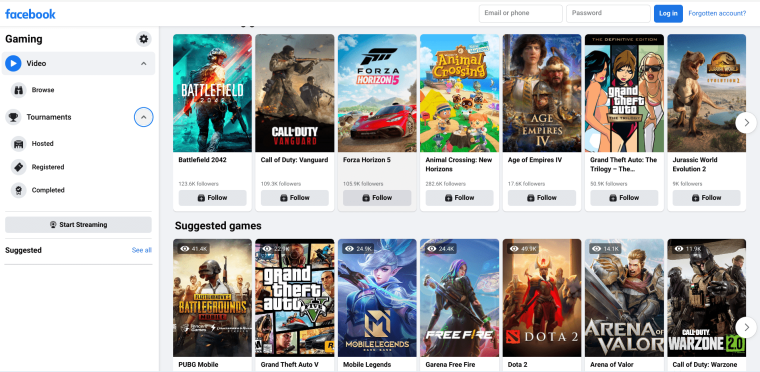
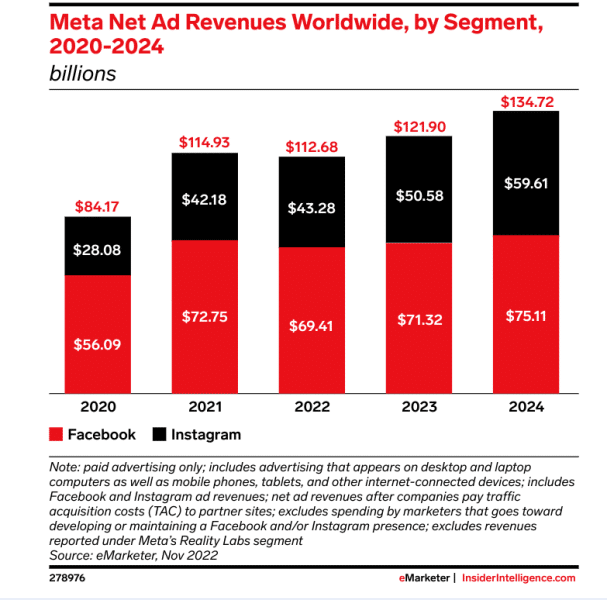
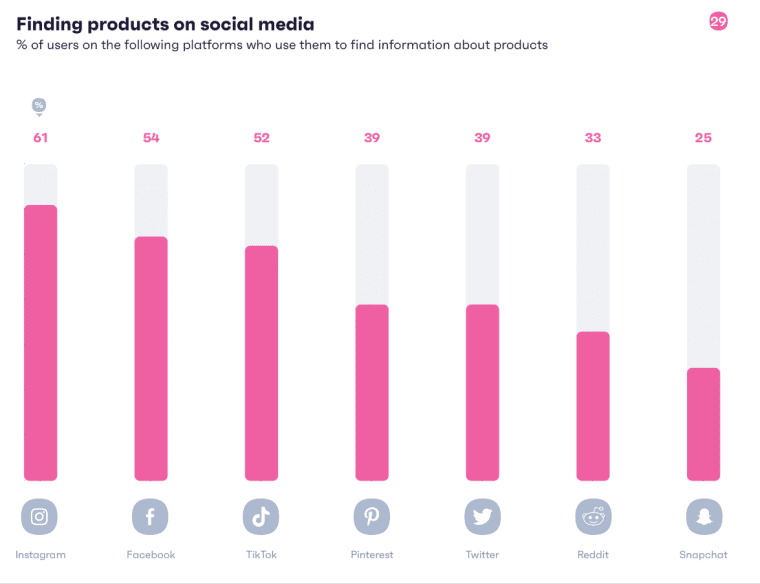
The investment data outlined below is for Facebook Inc, now Meta — Facebook’s parent company — and outlines its journey from a social start-up to a Big Five tech company. Facebook Inc. kicked off with an initial major investment of $500,000 in July 2004. Mark Zuckerberg, Dustin Moskovitz, Chris Hughes, and Eduardo Saverin launched what was then called ‘The Facebook’ from their Harvard dorm room in February. After incorporation in Delaware, angel investor and advisor Peter Thiel came on board as an early investor, purchasing a 10.2% stake. Thiel joined Facebook’s board and later cashed out just over $1 billion from his investment in 2012. Facebook Inc. raised $12.7 million in a Series A funding round. In 2005, Accel Partners invested in Facebook at a time when it was valued at around $100 million. The next Series B funding round saw Facebook Inc. raise $25 million. This was from Greylock Partners, Meritech Capital, and previous investors Accel Partners and Peter Thiel. At the time, Facebook was valued at about $525 million. Accel Partners invested a further $12.7 million, with Jim Breyer providing $1 million of his own funds. Facebook Inc. spent $200,000 on its domain in 2005. After dropping ‘the’ from its name, Facebook purchased the domain name Facebook.com from the AboutFace Corporation. In 2007, Facebook Inc. secured $240 million in a Series C funding round. Microsoft purchased a 1.6% stake in Facebook for $240 million, valuing Facebook at $15 billion. The deal also came with rights for Microsoft to place international ads on Facebook. In 2009, Facebook Inc. received $200 million in funding. Facebook was valued at $10 billion. Yuri Milner’s DST and Russian metals magnate Alisher Usmanov were part of the deal. By November 2010, Facebook Inc. was valued at $41 billion. Based on data on SecondMarket Inc. (an exchange for privately held companies’ shares), Facebook had a valuation of $41 billion. In 2011, Facebook Inc. received $1.5 billion. Goldman Sachs invested $450 million and DST invested a further $50 million, putting Facebook’s valuation at $50 billion. In May 2012, Facebook Inc. went public. At an IPO price of $38 per share, Facebook raised $16 billion. This would see founders Zuckerberg (15% stake), Moskovitz (6% stake) and Saverin (5% stake) become billionaires. However, share prices fell more than 40% over the next several months, with losses totaling $50 billion by August 2012. A major contributing factor was General Motors’ decision to pull $10 million in advertising from Facebook. By August 2013, Facebook Inc’s share price was back to IPO levels. Facebook’s acquisition of Instagram and its ad-centered business model gained momentum, with the company’s share price increasing by over 468% to peak at $217.50 in July 2018. However, just a day later, following the release of Facebook’s second-quarter results, stocks plunged by 19%. By year-end, Facebook’s share price was down 40% because of new community guidelines, fines, scandals, and data concerns. In 2019, Facebook Inc. shares gained 56.6%. Facebook bounced back from a record drop in its valuation as a result of impressive performance and reduced concerns over regulatory crackdowns. By the end of 2020, stocks were up 33% because of a covid induced jump in engagement and user numbers. Facebook Inc. became the fastest US company to hit a market cap of $1 trillion on June 28, 2021. Shares hit a price of $355.64, ushering Facebook into the trillion-dollar club. In October 2021, Facebook Inc officially became Meta Inc, marking the start of a new era. Meta has since survived its record $232 billion valuation drop in 2022 to become the world’s 8th most valuable company by market cap. As of 3 May 2023, Meta has a market cap of $607.44 billion and a share price of $239.24. As of April 2023, Meta has made 101 acquisitions. The most recent being Gary Sharp innovations in January 2023. Meta’s most notable acquisitions include: Meta has made 51 investments. The most recent being WiseCut in April 2023. Meta has called Menlo Park in California, US its headquarters since 2011. To accommodate growing operations, Meta moved its headquarters from Palo Alto to Menlo Park. The company acquired the 57-acre main campus in a $202 million deal. Meta has 21 data centers located across the US, Asia, and Europe. According to Meta, data centers are part of the global infrastructure that brings its technologies and services to life. Data centers and offices have achieved net zero emissions and are supported by 100% renewable energy. In addition, centers support new construction and operational jobs, supporting local businesses. Meta has made over 70 changes to the Facebook Algorithm since it launched the Facebook News Feed in 2006. As part of Meta’s growing effort to provide the best experience for billions of users across the world, Facebook’s algorithm is constantly updated. According to Buffer, the most recent updates include: In Q4 of 2022, 1.3 billion fake Facebook accounts were removed from the platform. Meta prioritizes enforcement against fake accounts that seek to cause harm. Facebook’s detection technology helps block millions of attempts to create fake accounts every day and detect millions more, often within minutes after creation. In Q4 2022, 6.4 million pieces of content were sanctioned for containing bullying and harassment content. Meta continues to invest in proactive detection technology to ensure cases of bullying and harassment on Facebook are dealt with to protect the community. Facebook took action against 1.8 billion pieces of spam content. According to Meta’s Community Standards Enforcement Report, content actioned increased from 1.4 billion in Q3 2022 to 1.8 billion in Q4 2022 because of an increased number of spam attacks in October 2022. The company continues to improve its detection capabilities. Facebook took action against over 15.5 million cases of organized hate and terrorism. Using its systems, Facebook was able to proactively identify and remove pieces of content related to violence, terrorism, and organized hate. Facebook removed over 5 million pieces of content in 2022 due to copyright, trademark, or counterfeit reports. Facebook continues to develop detection and enforcement tools to keep intellectual property violations at bay. As of January 2023, Facebook’s estimated ad reach is 1.98 billion. Offering access to some of the largest targeted audiences, Facebook is the prime destination for global brands and businesses alike. Older audiences are more engaged on Facebook. In contrast, audiences aged 18-24 are engaged only up to 75% of the time on Facebook when watching video ads. Facebook ads have an average click-through rate of 0.90%. This is the average across all industries, as determined by studies. The average conversion rate of Facebook ads is 9.21%. While some industries, such as fitness and healthcare, see much higher conversion rates, 9.21% was found to be the average conversion rate across all industries. As of 2022, Facebook generates the highest ROI for advertisers. Facebook boasts some of the highest conversion rates, making it a popular choice for businesses. In terms of social media platforms, Facebook yields the highest return on investment. Instagram, YouTube, and TikTok are not far behind. In Q3 2020, there were 10 million active advertisers on Facebook. This was up from 7 million advertisers in 2019. Over 200 million businesses use Facebook’s applications and free tools. These are mostly small businesses which rely on Facebook to reach their communities. There are 250 million Facebook Shops worldwide. Between January and March 2021, Facebook Shops had an average of one million monthly users and around 250 million active stores worldwide. As of 2020, over 160 million businesses use Facebook to interact with their customers. From advertising and brand awareness to customer service, Facebook continues to play a major role in how big brands and small businesses interact with customers. Much like it does for businesses, Facebook invests in building tools for creators. The social giant works to provide more ways to help creators manage their fans and increase their earning potential on Facebook. Facebook is empowering creators by giving them more ways to earn in 2023. Creators can make money through: In December 2022, Facebook lowered the payment threshold for US-based creators. Facebook is committed to getting creators to their first payout sooner by lowering the payment threshold for US-based creators from $100 to $25. This will help small, earlier-stage creators get paid sooner. The new payout threshold applies to Stars and Facebook Subscriptions and will be available for additional Facebook monetization products. In 2022, Facebook expanded Professional Mode for Profiles globally. This simplified the profile experience for creators, providing them access to monetization opportunities and professional tools. According to Meta, tens of millions of creators adopted the service, unlocking increased engagement with their fans. In 2022, Facebook created opportunities for creators to earn money for their Reels plays. The Reels Play bonus program, which officially ended on March 9, 2023, allowed eligible creators to be paid up to $35,000 a month based on the views of their qualifying reels. Creators can still earn money from their reels through Meta’s other monetization programs. TheFacebook.com was launched in February 2004, allowing Harvard students to post photographs of themselves and personal information about their lives. By June 2004, the social network had over 250,000 users and major corporations were lining up to pay for exposure on the site. At the end of 2004, The Facebook had reached one million active users. Below is a timeline of updates and other significant milestones that contributed to Facebook’s rise to the top. With the addition of features such as Reels, Stories, marketplace, and more, Facebook continues to revolutionize the social networking industry. Reels are short-form videos launched globally in 2022, allowing users to discover new people, content, and experiences. Facebook reels are reshared over 2 billion times every day. As Reels continue to encourage users to become more social, the number of users re-sharing reels has doubled since January 2023. Meta is investing in AI-powered discovery for Reels to deliver content that users will find engaging. With over 140 billion Reels plays across Facebook and Instagram each day, Meta is committed to improving the experience for users. Launched in 2017, Facebook Stories give users a platform to show and express more of life’s moments as they happen. In 2020, over four million advertisers used Stories ads every month. Facebook reported more discoverability, interest, and action from Stories ads. In 2019, Facebook reported that over 300 million people used Facebook Stories each day. Over 1 billion Stories get posted every day across Facebook apps and 73% of people in the US agree stories enable them to experience new things outside their everyday lives. Launched in 2016, Facebook Live allows users to share their experiences in real-time. 1 in 5 videos on Facebook is a live broadcast. According to Facebook, live content accounts for about 20% of the overall video content on the platform. Live video engagement is 26% on Facebook. This is higher than any other social media platform. In 2016, Facebook Marketplace was created to be a space dedicated to buying and selling items directly through the social network. In 2020, Facebook added Shops, allowing small businesses to present catalogs of their products, as in an online store. As of February 2023, car dealerships and real estate firms are restricted from listing on Marketplace. Meta’s new restrictions on vehicle and real estate listings are an attempt to maximize advertising revenue in 2023. Facebook Marketplace registered more than one billion monthly global users in 2021. Much like Marketplace, Facebook Shops showed positive growth and reported an average of one million monthly global users as well as 250 million active stores worldwide in the same year. Facebook Groups were launched in 2010. In 2020, Facebook confirmed that there were more than 400 million people in groups, up from 100 million in 2017. 1.8 billion Facebook users use Groups every month. As of 2023, over 10 million groups across different interests and geographical locations exist. In September 2022, Meta introduced community chats to Facebook Groups. In a bid to help people to connect more deeply with their online communities in real time, community chats were added to Groups. The move garnered positive results and Facebook saw the number of people using community chats increase by 50% in December 2022. In October 2022, Meta announced Reels in Facebook Groups. Facebook added Reels to Groups to allow communities greater creative expression through immersive videos. There are over 100 million Facebook group joins daily. According to Meta, most people on Facebook are members of at least 15 active groups, and there are more than 100 million group joins every day. Facebook Gaming is a platform on Facebook that enables users to live stream, watch, and explore gaming content, engage with gaming communities, and take part in various gaming experiences such as play-throughs, live streaming, and tournaments. Over 350 million people play instant games each month on Facebook. Additionally, over 230 million people are active in over 630,000 gaming Groups each month. PUBG Mobile was the most popular game watched on the Facebook Gaming streaming platform, as of March 2023. Gaming on Facebook has shifted from a single-player experience to a social occasion where players meet to play games together and watch others play online. With about 21.48 million hours of content watched, PUBG Mobile was the most-watched game on the platform. Mobile Legends: Bang Bang ranked second with 13.9 million hours of watch time. Facebook Gaming accumulated 382 million hours of live streams watched in Q3 2022. This is down from an all-time high of over 1.29 billion hours watched in the third quarter of 2021. As of 2022, Meta reports its revenue based on two segments: Family of Apps (FoA) and Reality Labs (RL). FoA includes Facebook, Instagram, Messenger, WhatsApp, and other services. RL includes Meta’s augmented- and virtual-reality related consumer hardware, software, and content. In 2022, Meta’s global revenue was $118.1 billion. This was up 1% from $117.9 billion in 2021. In 2022, advertising accounted for 97.5% of Meta’s revenue. While Family of Apps represents Facebook, Instagram, WhatsApp, and Messenger, Meta confirmed that almost all of its advertising revenue comes from Facebook and Instagram. FoA revenue in 2022 decreased by $1.21 billion, or 1%, compared to 2021. The decrease was mostly driven by a dip in advertising revenue. This was driven by: Meta reported a $23.1 billion net profit in 2022, a slight decline from the $39.3 billion in 2021. The decline in profitability comes as Meta continues to invest heavily in the Metaverse. In 2022, US and Canada accounted for 43% of Meta’s advertising revenue. The US and Canada remain Meta’s biggest revenue drivers. With a contribution of 22%, Europe is Meta’s next profit driver. In Q1 2023, Facebook’s average revenue per user (ARPU) in the US and Canada was $48.85. This is almost 5 times more than the global ARPU of $9.62 reported in Q1 2023. As of March 2023, Facebook hit 2 billion daily active users — the highest it’s ever been. Figures reflect that 37% of people on Earth use Facebook and that it is still a thriving platform, despite a rocky 2021. Facebook’s DAUs in the fourth quarter of 2021 dropped for the first time and Meta reported a negative outlook because of growing competition from TikTok and YouTube. The social giant also noted slower revenue growth as a result of advertisers reducing their ad spend. However, by Q3 of 2022, monthly active users on the platform had grown to 2.96 billion, showing a promising upward trend. Facebook’s daily active users were 2.04 billion for March 2023. This change in DAUs represents an increase of 4% year-over-year. Mark Zuckerberg attributes this to the company’s work in AI paying off. Facebook’s monthly active users (MAUs) were 2.99 billion as of March 31, 2023, This increase in MAUs represents an increase of 2% year-over-year. As of January 2023, men between the ages of 25 and 34 made up Facebook’s largest audience. The biggest audience base on Facebook makes up 17.6% of all the people who use Facebook around the world. Accounting for 10.9% of global users, men between the ages of 18 and 24 make up the second largest group of people using Facebook. With 314.6 million active users, India has the most users of any country. India tops the list for the most Facebook users in 2023, with the US coming in second with 175 million and Indonesia, third, with 119.9 million users. 23.8% of Facebook users in the US were aged between 25 and 34 years as of March 2023. This demographic accounts for Facebook’s largest audience in the country. The 18 to 24-year age group accounts for 18.4% while those aged between 13 to 17 are the smallest audience, at 3.9%. Data shows Facebook is popular among US Millennials and Gen X with over 77% of all active users in the country falling within these age ranges. Users in the US are also 54.8% more likely to be women. 97.4% of Facebook users access the platform from a mobile device. Additionally, 68.7% of Facebook users access the social network exclusively through their phones. This shows that Facebook users have a strong preference for mobile. Facebook was accessed by 59% of mobile audiences in the US. In January 2023, the Facebook app came third on the list of mobile apps with the greatest reach in the US. The YouTube mobile app ranked first with a 74% audience reach, while Gmail ranked second with a reach of 61%. 28.7% of Facebook users access the platform using both mobile devices and PCs. About 2.6% of users prefer to access Facebook on their desktops or laptops. 54% of users on Facebook are there to find information about products. According to GWI, the number of people using social media for product searches has increased by 43%. While Instagram leads with 61% of its users using the platform to discover products, Facebook is a close second with 54% of users using the platform to find product information. 54% of users reported watching videos on Facebook in Q2 of 2022. As short- and long-form video takes over, Facebook is seeing an increase in the type of media users engage with. 71% of users say they use Facebook to message friends and family. The GWI 2023 Social Trends report confirms that messaging friends and family is still the top activity on Facebook. Other popular activities include keeping up to date with news and events 62.9% use Facebook for posting and sharing photos and videos. Although Facebook has evolved into so much more, over half of all users still use it to post or share photos and videos. 59.5% of Facebook users use the platform to keep up with news and events. According to findings in the GWI Global Media Landscape report, more people are using social media to stay up to date with what’s happening around them. The trend is growing on Facebook, too, with over half of all users turning to the platform for news and event updates. 55.2% of users follow and research brands and products on Facebook. While it is still a prolific social platform, Facebook has emerged as a key platform for learning about brands and their products, with 44% of users admitting Facebook influences their shopping decisions. 60% of Facebook users use the platform to get customer service. More users are turning to Facebook to get customer service. 69% of brands provide customer service through the platform. Users spend an average of 9 minutes and 58 seconds on Facebook. This is according to data collected by Similar Web. It is also estimated that the average user visits at least 9 pages per unique session. As of 2022, links make up 47.2% of all posts on Facebook. Photos come in second at 35.6%, followed by videos at 15.1%. Of all content types photos, videos, and status posts had the highest engagement rates on Facebook. In 2022, photo posts had an engagement rate of 0.12% while status and video posts had engagement rates of 0.11% and 0.08% respectively. Link posts had the lowest engagement rate at 0.03%. Facebook users on Android spend an average of 19.7 hours a month on the platform. Facebook comes in third behind YouTube’s 23.4 hours a month and TikTok’s 22.9 hours. Facebook users prefer to watch videos with the sound off. People are much more likely to watch a video to completion when it has captions and is silent. In fact, 80% of Facebook users have a negative reaction to feed-based mobile videos playing loudly. With almost three billion monthly active users (MAU) as of January 2023, Facebook remains the social media giant to beat. Facebook was the first social network to breach one billion registered accounts and currently boasts over 2.9 billion monthly active users. Meta owns four of the biggest social media platforms, all with over one billion monthly active users each: Facebook (core platform), WhatsApp, Facebook Messenger, and Instagram. In the final quarter of 2022, Facebook reported over 3.7 billion monthly users across its family of apps. Facebook is the third most visited website in the world. Google and YouTube occupy positions one and two. Facebook comes in third, putting it ahead of other leading platforms like Twitter and Instagram. Facebook ranks fourth on the list of top Google searches. According to We Are Social’s 2023 Digital Report, top queries include ‘Google’ at number one, ‘YouTube’ at number two, and ‘Video’ in the number three spot. In March 2023, Facebook accounted for around 53% of all social media site visits in the US. Twitter ranked second with 16% of all U.S. social media site visits, while was in Instagram in third place, accounting for 13.85%. As of 2021, Facebook Gaming had a market share of 12.09%. This is behind Twitch, which has a massive 72.29% share of the market, and YouTube gaming which comes in second with a 15.62% share. In 2021, Facebook had a digital ad revenue share of 23.7%. This is behind Google, which has a share of 28.6%, while Alibaba is third with an 8.7% share. In 2022, 19% of US social buyers made purchases on Facebook. Facebook was the top social network for shopping in the US in 2022. Instagram came second with 12% of social buyers using the platform to make purchases. By 2025, 114.3 million US online users are expected to make purchases through social networks, and Facebook is projected to hold a significant share of the market. Key Facebook Stats
Facebook Inc Investment Data
Facebook Business Data
Date
Facebook Algorithm Update Description
February 15, 2022
The “News Feed” is replaced with “Feed”.
April 22, 2021
Mini-surveys are released to better understand what people want to see.
March 31, 2021
Users have more control over their News Feed.
July 2, 2019
Misinformation around health is targeted.
May 16, 2019
More signals get introduced to the algorithm to help it determine which posts are most important to users.
May 6, 2019
Video creators are encouraged to publish original videos.
April 10, 2019
Analyzing the “Click-Gap” combats fake news.
Facebook Advertising Stats
Facebook for Business Stats
Facebook Creator Stats
Facebook History and Timeline
Facebook Product Data
Facebook Reels
Facebook Stories
Facebook Live
Facebook Marketplace
Facebook Groups
Facebook Gaming
Facebook Revenue Data
Facebook Demographics Data
User Statistics

Country
Active Facebook Users (millions)
India
314.6
United States of America
175
Indonesia
119.9
Brazil
109.1
Mexico
83.8
The Philippines
80.3
Vietnam
66.2
Thailand
48.1
Bangladesh
43.3
Egypt
42
Usage Statistics
Facebook vs Competitor Stats
Rank
Social Network
Monthly active users as of January 2023 (in millions)
1
Facebook
2,958
2
YouTube
2,514
3
WhatsApp
2,000
4
Instagram
2,000
5
WeChat
1,309
6
TikTok
1,051
7
Facebook Messenger
931
8
Douyin
715
9
Telegram
700
10
Snapchat
635
11
Kuaishou
626
12
Sina Weibo
584
13
QQ
574
14
Twitter
556
15
Pinterest
445
References
