In a world where screens dominate our lives and clicks hold the power to shape businesses, understanding the ever-changing market of digital marketing is no longer a luxury but a necessity. From the explosive growth of social media platforms and influencer marketing to the subtle art of search engine optimization, digital marketing is a dynamic and intricate ecosystem that can make or break brands instantly.
In this curated list of digital marketing statistics, we will delve into eye-opening numbers and game-changing trends that redefine your perception of the power of pixels and the art of engagement.
Digital Marketing Statistics Highlights
Digital Marketing Industry Statistics
Digital marketing has emerged as a powerhouse, revolutionizing how businesses promote their products and services. With its ever-expanding reach and unprecedented targeting capabilities, it has become an essential tool for companies to effectively connect with their target audience.
The digital marketing and advertising market was estimated at $531 billion in 2022 worldwide.
By 2026 it is forecasted to reach $786.2 billion.
In the US, search advertising claims the title of the largest market in terms of market volume, reaching $118.20 billion in 2023.
With such a substantial market presence, it is no surprise that 82% of marketers were actively allocating resources to content marketing in 2021.
Among B2B marketers, 40% have a documented content marketing strategy, and 69% dedicate their time to investing in SEO.
This highlights the significant role that content marketing plays in the digital marketing landscape and its importance for businesses aiming to stay competitive and reach their target audience effectively.
In April 2023, the global internet user count reached 5.18 billion, accounting for 64.6% of the world’s population.
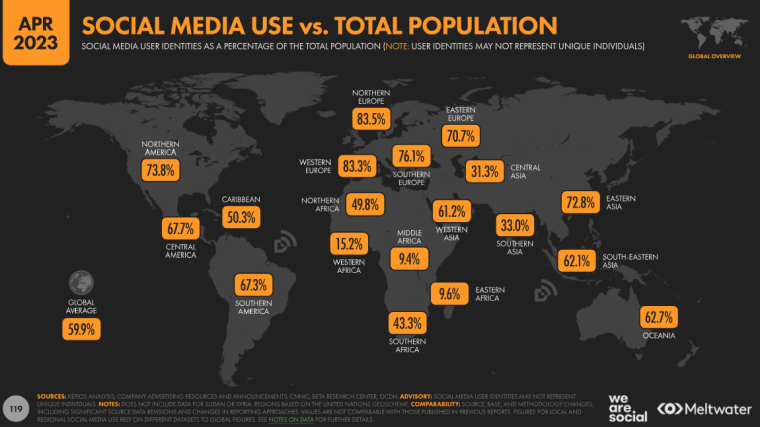
Among these users, 4.8 billion individuals were actively engaged in social media platforms, equivalent to 59.9% of the global population.
As per Data Reportal, the top three reasons for using the internet are as follows:
- Finding information
- Contacting friends and family
- Watching videos and shows
- Following news and events
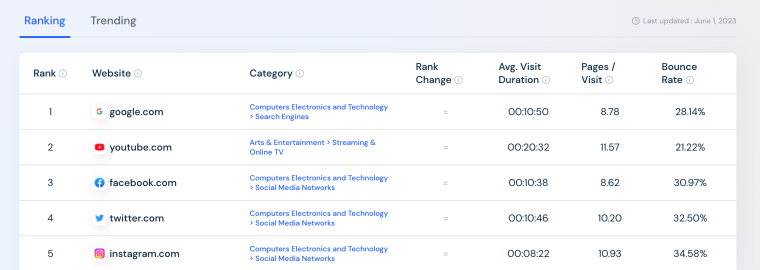
As of June 2023, the list of the world’s top websites is dominated by search engines and social media platforms.
According to Internet Live Stats, in 2022, Google handled over 99,000 searches every second.
This equals more than 8.5 billion searches conducted on Google daily.
During May 2023, Google recorded a remarkable total of 88.1 billion visits across both desktop and mobile platforms. These visits had an average duration of 10.50 minutes, and users viewed an average of 8.78 pages per visit.
Benefits of Digital Marketing
Companies that demonstrate excellence in nurturing leads through inbound marketing witness a remarkable 50% increase in sales.
This can be accomplished by crafting targeted content that addresses the unique needs of your audience and utilizing multiple content channels to engage with them effectively.
Digital marketing offers numerous advantages for businesses in today’s digital age.
The key benefits of digital marketing are presented below:
| Benefits of Digital Marketing | Details |
| Global Reach | Enables businesses to reach a vast global audience, overcoming geographical limitations. |
| Cost-Effective | More economical marketing solutions compared to traditional methods, allowing businesses of all sizes to compete. |
| Targeted Advertising | Allows precise targeting based on demographics, interests, and online behavior, ensuring that marketing efforts reach the right audience. |
| Measurable Results | Provides comprehensive analytics and tracking tools to measure the effectiveness of campaigns in real time, allowing for data-driven decision-making. |
| Increased Engagement | Digital marketing channels facilitate direct and interactive customer communication, fostering engagement and building lasting relationships. |
| Personalization | Enables personalized marketing experiences, tailoring messages, and content to specific customer preferences, enhancing brand relevance. |
| Flexibility | Allows quick adjustments to campaigns, responding to market changes, and optimizing strategies in real time. |
| Higher Conversion Rates | Effective tactics can lead to higher conversion rates, turning leads into customers and driving business growth. |
| Brand Building | Businesses establish and strengthen their brand presence, creating brand awareness and loyalty among the target audience. |
According to the Content Marketing Institute, 77% of marketers successfully enhanced their company’s credibility and trust by implementing digital marketing content tactics.
The same report revealed that 83% of them effectively generated brand awareness, while:
- 72% educated their audience.
- 67% generated demands and leads.
- 44% built and grew their subscribed audience.
- 42% generates sales and revenue.
- 42% supported the launch of a new product.
Digital Marketing by Sector
Businesses can differentiate themselves from the competition regardless of the industry or sector by implementing effective digital marketing strategies and growth hacking techniques.
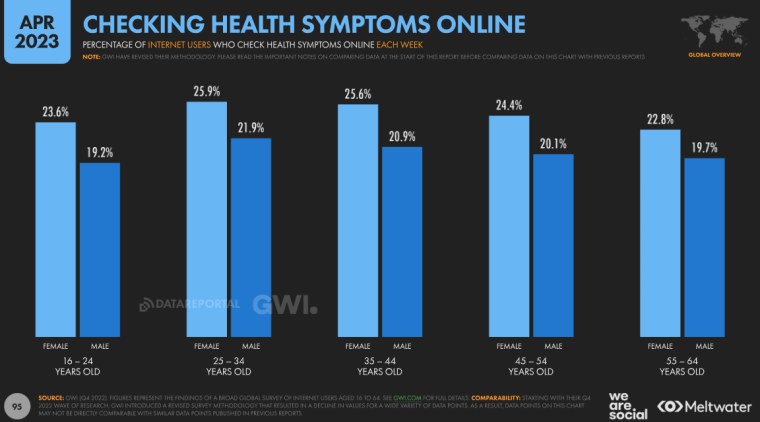
77% of the population Google the symptoms when they are feeling off or when they feel they are not doing well.
According to Google’s Year in Search 2022, the top health industry searches on Google related to:
- Workouts
- Coping with difficult emotions
- Resources on mental health
- Dial 988 – the National Suicide Prevention Lifeline for mental health crises
Within the entertainment industry, digital marketing serves as an essential tool to effectively reach a vast audience.
According to a study from Neustar shared with Marketing Dive, digital advertising accounts for 14% of movie ad budgets, generating a significant 46% of the total revenue.
With Facebook, paid media constituted 4% of movie media budgets. Every dollar invested in Facebook advertising resulted in an impressive return on ad spend of nearly $8.
Online shopping also owes its fair share of success to digital marketing – according to a recent analysis, over 37 million social media users generate more than 529,000 e-commerce sales.
Facebook has been responsible for driving 11.4% of total sales for online stores.
Regarding traveling, received wisdom within the industry says that 90% of individuals research their trips online before booking.
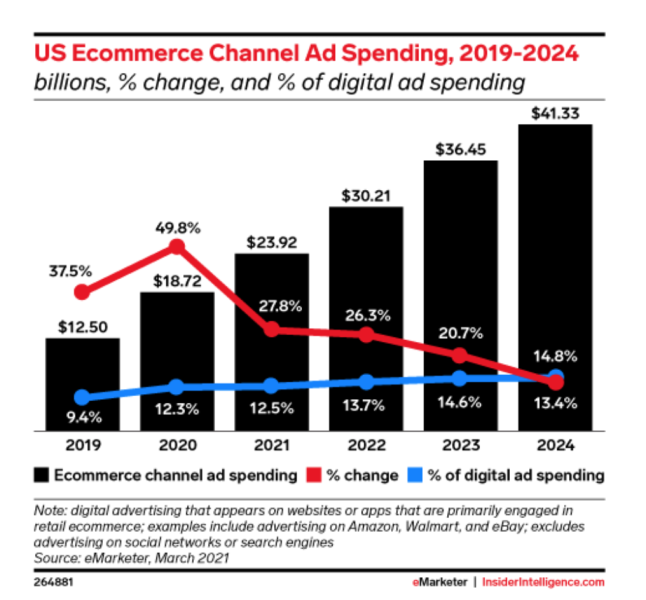
By 2023, digital advertising expenditure by US retailers is anticipated to surpass $50 billion, representing a projected increase of 50% compared to 2020.
Data on the Different Types of Digital Marketing
Online Advertising and PPC Statistics
The global digital ad spend is estimated to reach $836 billion by 2026.
Digital marketing accounts for 55% of overall marketing efforts, significantly surpassing offline advertising.
In 2021, the total digital advertising spend reached $436 billion, while offline advertising amounted to $196 billion.
In 2022, local businesses allocated approximately 5-10% of their revenue toward their digital marketing budget.
However, this percentage reached up to 14% for some larger businesses.
When comparing globally, the US takes the lead in ad spending, generating a significant amount of $271.20 billion in 2023.
Search advertising emerges as the largest market within the industry, boasting a market volume of $118.20 billion.
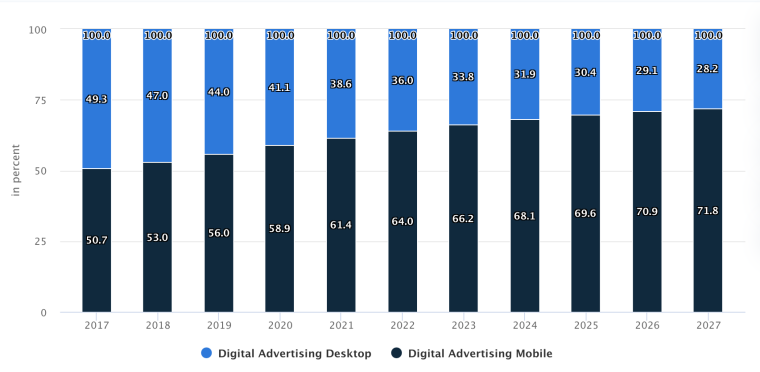
By 2027, mobile will account for a substantial 71.8% of total ad spending in the digital advertising market.
U.S Digital Ad Spending vs UK Ad Spending
In 2023, the projected average ad spending per user in the search advertising market in the US is estimated to reach $378.60 billion.
Despite an increase of nearly $20 billion compared to the previous year, digital advertising spending in the United States is experiencing its slowest growth rate in more than ten years.
The average digital ad spending, which stood at 37.6% in 2021, fell to 7.8% in 2023.
The retail sector was estimated to have the highest expenditure on digital advertising.
The projected investment in digital advertising for the retail sector in 2022 was significant, with a substantial amount of $57.2 billion.
Following closely behind, consumer packaged goods (CPG) services secured the second position, allocating a considerable budget of $36.03 billion to digital advertising.
Amid challenging economic conditions, the UK market will witness a drastic decline in ad spending, with a significant drop from 36% in 2020 to a forecasted 7.8% by 2027.
This sharp decrease underscores the substantial impact and shift in priorities within the advertising landscape.
Like the industries in the US, retail emerged as the leading sector in digital ad spending in the UK in 2022, allocating a substantial amount of £5.92 billion ($8.14 billion).
The consumer packaged goods (CPG) industry also claimed second place in the UK, dedicating a significant budget of £3.85 billion ($4.7 billion) to digital advertising.
Digital Marketing Ad Share and Spending Statistics of US Companies
According to eMarketer research, Amazon’s digital ad spending has increased significantly, from 9.9% in 2020 to 12.9% in 2023.
The expected digital ad spending of Amazon in 2025, reaching 15.2%, serves as clear evidence of the notable growth and impact the company has experienced during the COVID-19 pandemic.
Unsurprisingly, TikTok demonstrated a significant increase in its share of digital ad spending, rising from 0.5% in 2020 to 2.3% in 2023. It is estimated to continue its steady ascent, reaching 2.9% by 2025.
Microsoft has showcased remarkable consistency in its digital ad share, maintaining a steady 3.5% in 2020 and experiencing a modest increase to 3.7% in 2023.
The mega software company is projected to elevate its digital ad share to 4.1% by 2025, solidifying its position in the market.
In contrast, Meta’s digital ad spending is estimated to drop from 23.7% in 2020 to 18.4% in 2025.
Similarly, Google’s share of digital ad spending is expected to decrease from 27.4% to 24.6%.
The combined share of the US digital ad market held by Google and Meta fell below 50% in 2022, and it is projected to decline even further to 43.0% within a few years.
However, increased retail media ad spending can potentially propel Amazon to secure the second place. In 2021, Meta’s US ad revenues exceeded Amazon’s by more than twofold.
Amazon is progressively closing the gap in digital ad spending share, with 12.9% for Amazon compared to 19.5% for Meta in 2023.
By 2025, the market share difference between these industry giants will shrink to a mere 3.2 percentage points.
As per the same source, Google is experiencing its most sluggish growth rate since 2009, with a 2.9% increase in net ad revenues projected for 2023, totaling $71.50 billion.

Even with YouTube included, the figures are expected to reach 3.3% and $78.86 billion.
Nonetheless, these figures must still catch up to Alphabet’s usual standards.
In 2024, Google’s share of search ad spending is anticipated to dip below 50% for the first time.
Digital Ad Revenue Statistics by US Companies
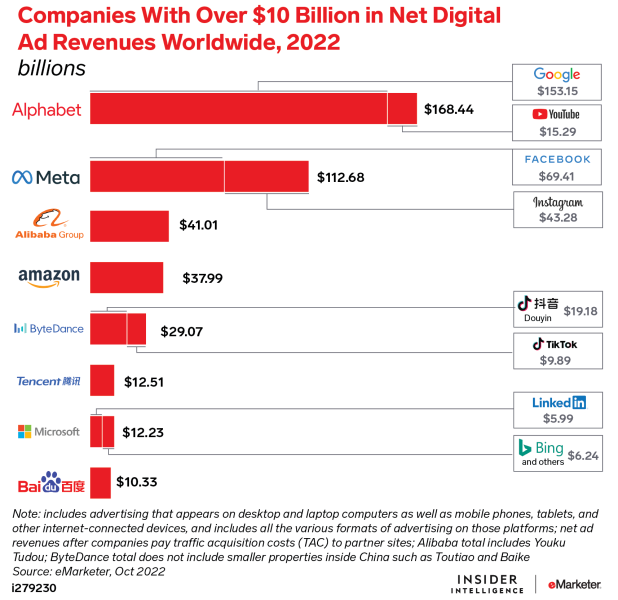
In 2022, Alphabet’s net digital ad revenue worldwide amounted to an impressive $168.44 billion.
Out of this total, $153.5 billion was generated by Google, while YouTube contributed $15.29 billion to the company’s revenue.
Meta secured the second position and reported a cumulative net digital ad revenue of $112.68 billion in 2022.
Facebook accounted for $69.41 billion, while Instagram added $43.28 billion to Meta’s overall net digital ad revenue.
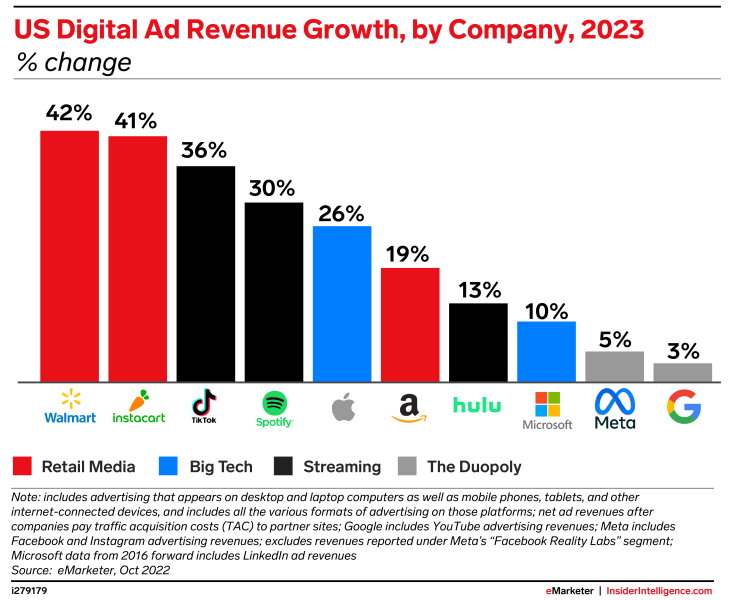
Retail media is anticipated to reach a global growth rate of over 10% annually, resulting in an estimated increase of $50 billion from 2022 to 2026.
It is experiencing a notable upsurge, with Walmart and Instacart showcasing the highest growth rates.
Although Amazon’s ad business is growing slower than other retail media networks, its US ad revenues surpass the competition at $34.59 billion.
In contrast, Walmart is expected to generate a fraction of that amount at $3.16 billion, while Instacart’s ad revenues will be even lower at $1.12 billion.
Search Advertising Benchmarks Statistics
Search advertising is one of the most powerful paid media channels, delivering remarkable results. However, it is also one of the most fiercely competitive channels, emphasizing the need to consistently optimize and enhance your performance.
The average cost per click for search ads in 2022 typically ranges from $2 to $4.
Industries such as legal services, dentists, and home improvement have consistently exhibited higher average costs per click, ranging from $6 to $8.
This can be attributed to lower click-through rates in these industries, contributing to higher costs per click (CPCs).
Some industries are more competitive and have higher marketing costs, longer decision cycles, and a greater emphasis on each individual conversion due to the relatively higher expenses associated with their services.
(cost per click) (cost per lead) (click-through rate) (conversion rate)
Business Industry
Avg CPC $
Avg CPL $
Avg CTR %
Avg CVR %
Attorneys & Legal Services
8.67
83.10
4.24
9.33
Dentists & Dental Services
7.10
50.91
5.03
13.33
Home & Home Improvement
6.11
54.05
4.62
11.21
Business Services
4.85
73.30
5.17
5.31
Finance & Insurance
4.57
74.44
5.70
5.59
Industrial & Commercial
4.18
49.90
5.61
7.78
Health & Fitness
4.01
45.60
6.15
9.21
Career & Employment
3.94
81.45
5.93
4.58
Education & Instruction
3.94
54.60
6.17
5.93
Physicians & Surgeons
3.78
29.96
6.25
15.07
Personal Services (Weddings, Cleaners, etc.)
3.32
29.08
6.95
10.18
Automotive — Repair, Service & Parts
3.13
18.73
5.65
12.74
Beauty & Personal Care
3.10
40.04
5.92
6.88
Animals & Pets
2.86
17.46
7.08
15.45
Apparel / Fashion & Jewelry
2.66
57.97
6.27
2.06
Furniture
2.39
76.71
6.01
2.59
Furniture
2.27
46.99
8.67
5.77
Shopping, Collectibles & Gifts (General)
2.25
30.27
5.50
3.07
Restaurants & Food
1.84
26.58
7.60
5.54
Sports & Recreation
1.73
31.50
8.82
5.86
Travel
1.63
46.06
9.19
5.19
Arts & Entertainment
1.51
50.40
11.43
4.81
Real Estate
1.36
44.70
8.55
3.52
Pay-Per-Click Advertising (PPC)
PPC ads serve the purpose of directing traffic to websites, with the advertiser being charged by the publisher only when their ads are clicked.
There are two main categories of PPC ads: search advertising and display advertising.
On average, people are exposed to around 347 banner ads per day – this is just one.
The predominant type of PPC advertising is conducted on search engines like Google Ads, Bing, and Yahoo, where advertisers participate in keyword bidding to have their search ads displayed prominently on search engine results pages (SERPs) when relevant keywords are searched.
Google Ads display on over 650,000 apps.
- 2 million publishers are registered on Google Adsense.
- 80% of people trust PPC and Google to deliver impactful advertisements.
As per the same source, 74% of brands find PPC ads impactful for their business.
This could be attributed to the fact that 71% of mobile searchers visit a nearby business within a day, with 28% of those searches resulting in a purchase.
Google PPC ads have the biggest ROI of 200%, meaning you will receive $2 for every $1 invested.
PPC display advertising generates 300% more traffic to a website through the use of photographs, videos, and animation.
Social media advertisements also follow PPC metrics to track results.
Some of the important social PPC metrics include:
- Cost per click (CPC)
- Cost per mille or 1,000 impressions (CPM)
- Cost per conversion/cost per action/cost per lead
- Cost per video view
- Cost per engagement (likes, comments, etc.)
- Cost per app install
- Cost per follower
The first ad position on a Google SERP gets a 2.1% CTR, while the second position gets a 1.6% CTR.
Top Digital Ad Management Platforms
When it comes to managing and optimizing digital advertising campaigns, there are several platforms available that provide businesses with the tools they need to reach their target audience and drive results effectively.
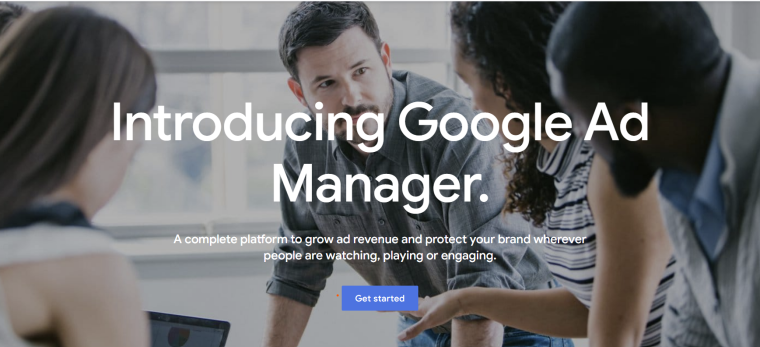
- Google Ad Manager
- Meta Business Suite
- Marin Software
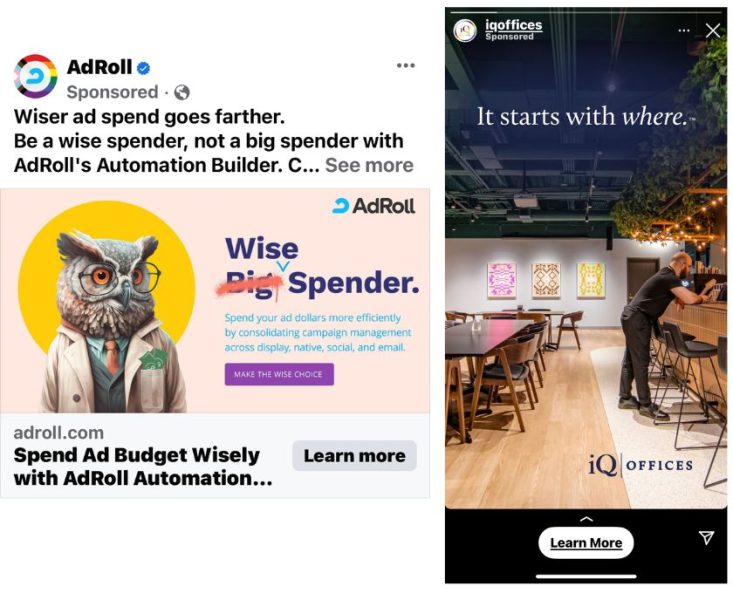
- AdRoll
- WordStream
- RollWorks
- Celtra
- The Optimizer.io
SEO Statistics
SEO is crucial for businesses as it helps improve their visibility and rankings in search engine results. By optimizing websites and content for relevant keywords, businesses can attract more organic traffic and increase their chances of being discovered by potential customers.
In 2022, the global market for Search Engine Optimization (SEO) was estimated at $68.1 billion.
As per Research & Market’s SEO Report, the global market size is expected to reach $122.11 billion in 2028 and is expected to grow at a CAGR of 9.6% during the forecast period.
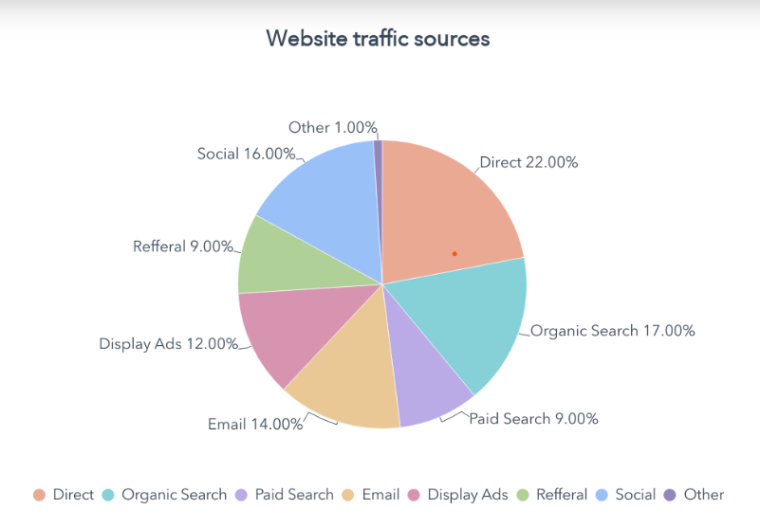
In 2022, organic traffic accounted for 17% of website traffic, while paid search traffic contributes approximately 9%, according to digital marketing statistics from Hubspot.
Search Engine Journal reports that 49% of all marketers acknowledge that organic search delivers the highest ROI among all marketing channels.
The return on investment (ROI) for Google organic search traffic is significantly higher, with 5.3 times more value than paid search.
SEO provides better ROI than PPC advertising due to its long-term benefits, while PPC offers immediate results but at a higher cost.
50% of businesses claim that SEO is their best ROI generator.
Despite the challenges posed by the COVID-19 outbreak, businesses invested approximately $47.5 billion in SEO and related products and services in 2020.
Nearly 67% of organizations outsource SEO.
Due to the diverse range of tasks involved in SEO, such as content creation and page speed optimization, businesses often choose to outsource this aspect of their digital strategy.
SEO boosts lead generation by attracting online visitors searching for products or services, boasting a high average conversion rate of 14.6% compared to traditional strategies at 1.7%.
With the first Google listing capturing 33% of search traffic, SEO offers valuable search engine visibility, benefiting numerous businesses.
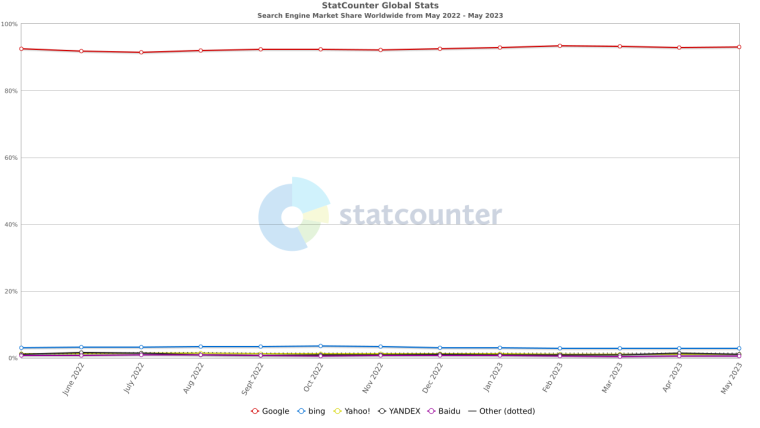
Google is the dominant player in the world’s search engine market share, holding 93.12% as of June 2023.
Bing holds a market share of 2.77%, while Yahoo accounts for 1.11%.
In December 2022, Google handled a staggering 9.99 million search queries, solidifying its dominance in the search engine market.
Google accounted for 61.4% of the U.S. desktop search queries and stood as the leading mobile search provider.
The top-ranked website in Google search results gets 34% of the organic traffic.
Achieving high rankings in search results is critical, as it has the potential to greatly boost website traffic and drive increased sales.
Falling off the first page can lead to a 143% decrease in traffic.
Aiming for a position higher than number 10 on the first page is crucial to avoid a drop in traffic for a specific keyphrase, as even being listed at number 10 can potentially push you off the first page.
The following KPIs are utilized to measure the ROI of SEO content:
- Organic website traffic
- Search rankings
- Organic click-through rate
- Bounce rate
- Organic conversion rate
- Average time spent on page
- Organic visibility
Globally, Semrush and Ahrefs stand out as the top two widely used SEO tools.
Semrush reported 97,000 paying customers as of December 2022 along with 800,000 free users.
Other notable search engine optimization platforms include:
- SpyFu
- KW Finder
- Moz Pro
- Ubersuggest
- Woorank
Social Media Statistics
In April 2023, there were 4.8 billion active social media users out of 5.18 billion internet users.
Social media users comprised 59.9% of the total population during the same period.
The global market for social media experienced significant growth, reflecting a compound annual growth rate (CAGR) of 19.4%.
It expanded from $193.52 billion in 2022 to $231.1 billion in 2023, demonstrating its strong upward trajectory.
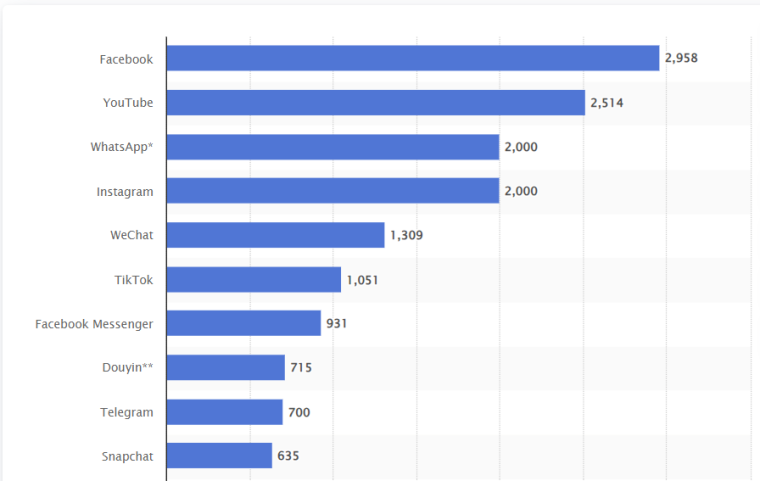
The social media market is projected to reach $434.87 billion by 2027, with a compound annual growth rate (CAGR) of 17.1%. This forecast highlights the industry’s strong potential for continued expansion and signifies its increasing significance in the digital landscape. As of Q4 2022, a typical social media user actively uses or visits an average of 6.6 social platforms monthly. They spend an average of 2 hours and 24 minutes daily using social media. Within the workplace, social media has become an indispensable tool for professionals, as evidenced by the fact that 86.3% of them rely on various social media platforms. 61.4% utilize these platforms daily, highlighting the consistent integration of social media into their work routines. Among individuals aged 16-64, the top-three motives for utilizing social media platforms include: Meta’s Facebook and Instagram collectively dominate the world’s social media market share, accounting for 78.22% of the total. Facebook alone holds 65.57% market share, while Instagram contributes 12.65%. In January 2023, Facebook reported 2.9 billion monthly active users. This makes it the world’s most popular social media platform. The chart below reveals key demographic statistics of major social media platforms, offering insights into the diverse audiences they attract. (hrs monthly) UK – 36,250,000 UK – 57,100,000 UK – 33,450,000 UK – 20,317,5 00 UK – 23,150,000 UK – 36,000,000 UK – 16,100,000 81% of organizations leverage social media as a powerful tool to enhance brand awareness. This aligns with the fact that users themselves rely on social media platforms to conduct brand research. Social media advertising allows businesses to connect with a diverse global audience and tailor their campaigns to reach specific demographics, interests, and behaviors. The social media advertising market holds the second-largest position in digital marketing. It generated global revenue of $226 billion in 2022 and is forecasted to reach $385 billion by 2027. Social media’s share of total digital advertising spending accounts for 33.9%. Businesses are projected to invest $300 billion in social advertising by 2024. Paid social media advertising provides a cost-effective way to target your competitors’ audience on search, which could explain its popularity. According to a survey conducted in October 2022, Facebook emerged as the leading social media platform with the highest return on investment (ROI), as reported by 22% of B2B and B2C marketers. Instagram, YouTube, and TikTok closely followed, receiving 16% of the votes, while LinkedIn garnered 7%. (billions) (cost-per-thousand-impressions) In 2022, the volume of social media ad impressions witnessed a remarkable growth of over 30% compared to the previous year. Meanwhile, the CTR in Q3 2022, which measures the percentage of users who click on a specific link or ad, achieved a rate of 1.21%. This marked a slight decrease from the CTR of 1.3% recorded in the same quarter of the previous year. Social media platforms have different types of ads for various purposes. By 2024, the social video advertising market is anticipated to reach a substantial value of $79.28 billion. Social advertising videos have a powerful impact on engagement, generating 1,200% more shares than text and image content combined. Video content can significantly enhance click-through rates, with an impressive increase of up to 96%. Carousel ads featuring a combination of images and videos have an average engagement rate of 2.33%, surpassing the rates for standalone images (1.74%) and video posts (1.45%). With their authentic and relatable content, influencers can establish trust, foster connections, and create meaningful brand experiences, making them invaluable partners in digital marketing. By January 2023, the global influencer market reached an estimated value of $21.1 billion, representing a notable increase from approximately $16.4 billion in 2022. In 2023, 71% of B2C organizations will utilize influencer marketing, indicating its growing popularity. This is likely attributed to the strong return on investment (ROI) that influencer marketing offers, positioning it as a top choice among digital marketing strategies. With brands earning up to $5.78 for every $1 spent on influencer marketing, it’s no wonder that 91% of marketers view it as an effective marketing strategy. In fact, 72% of marketers acknowledge that influencer marketing attracts higher-quality customers. While most brands allocate less than $10,000 annually to influencer marketing, a notable 11% invest over $500,000 in this strategy. The increasing engagement between consumers and content creators drives the growth of influencer marketing activity and brand budgets. As for demographics, the 16-24 group represents the largest segment, comprising 54.9% of active users who actively engage with influencers. The United States has nearly a quarter of its users actively following influencers, while Nigeria has the highest percentage of users engaging with influencers. The types of social media influencers can be broken down as follows:
Year
Social Media Users in billions
Year-on-year growth
2018
3.2
15%
2019
3.5
8%
2020
3.7
7%
2021
4.2
13%
2022
4.6
10%
2023
4.8
3%
Demographic Statistics by Social Media Platforms
Platform
MAU
Age
Gender Ad Reach
Usage
Ad Audience
Facebook
2.9 billion
18.17
US – 186,400,000
YouTube
2.5 billion
27.19
US – 246,000,000
Instagram
1.6 billion
12.30
US – 168,600,000
TikTok
1.09 billion
31.2
US – 116,496,000
Snapchat
654.4 million
3.17
US – 108,800,000
LinkedIn
922.3 million
0.17
US – 200,000,000
Twitter
372.9 million
4.48
US – 64,850,000
Advertising in Social Media
Platform
Reach
Avg CPC $ (cost-per-click)
Avg CPM $
YouTube
2.56
$3.21
$9.68
Facebook
2.11
$0.97
$7.19
Instagram
1.48
$3.56
$7.91
TikTok
0.88
$1.00
$6.06
LinkedIn
0.81
$5.26
$6.59
Snapchat
0.56
x
$2.19
Twitter
0.23
$1.50
$3.50
Influencer Marketing and Social Media
Mega-influencers may have a large following, but micro-influencers have become the top pick for brand collaborations.
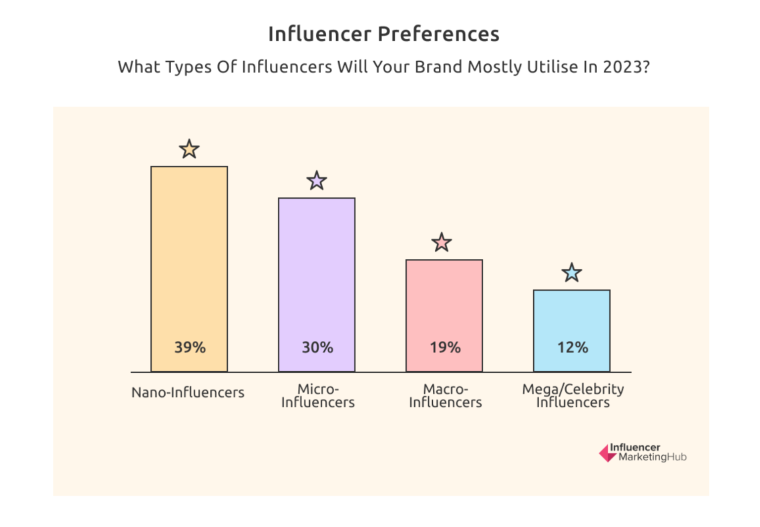
According to Influencer Marketing Hub, 39% of brands prefer to partner with nano-influencers, while 30% choose micro-influencers as their preferred collaborators.
A smaller percentage of brands focused on larger influencers, as only 19% preferred macro-influencers, and 12% chose mega/celebrity influencers.
30% of consumers trust influencers more than high-profile figures or celebrities.
A survey by Takumi reports that 46% of respondents agreed that influencers on social media influenced them to purchase a product or service. Furthermore, 31% of consumers in the UK and the US find creator content to be more relatable and relevant compared to a brand’s own advertising efforts.
As per a study performed by Matters Communications, consumers are most interested in seeing influencer posts about:
- Food and beverages (56%)
- Health and wellness (48%)
- Personal technology (45%)
- Consumer goods (40%)
- Beauty and personal care (33%)
- Baby and kids (13%)
Consumers are most likely to take action from an influencer post – purchase, conduct research, share with others, or consider a product – in the following content categories:
- Food and beverages (51%)
- Health and wellness (39%)
- Personal technology (37%)
The global Instagram influencer market became a $15 billion business in 2021, as the number of brand-sponsored influencer posts on the platform exceeded three million.
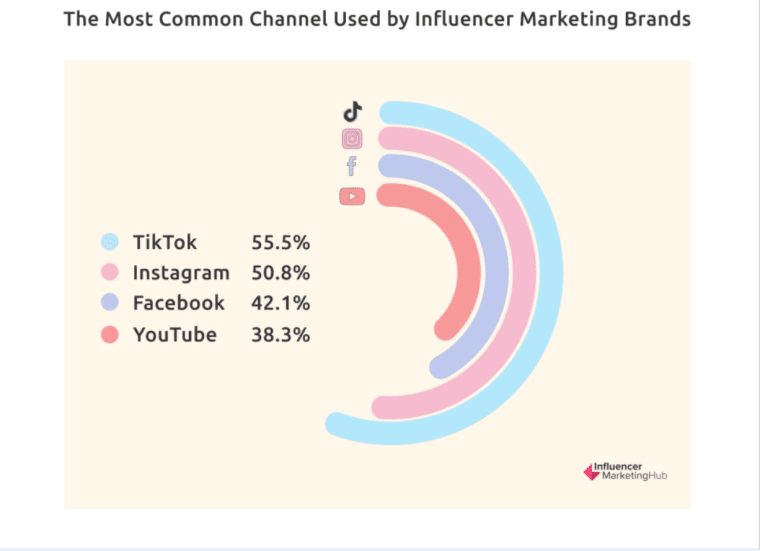
Instagram was the platform of choice for 97% of influencers, followed by TikTok at 59%, YouTube at 31%, Facebook at 24%, Pinterest at 20%, Twitter at 14%, and Snapchat at 3%.
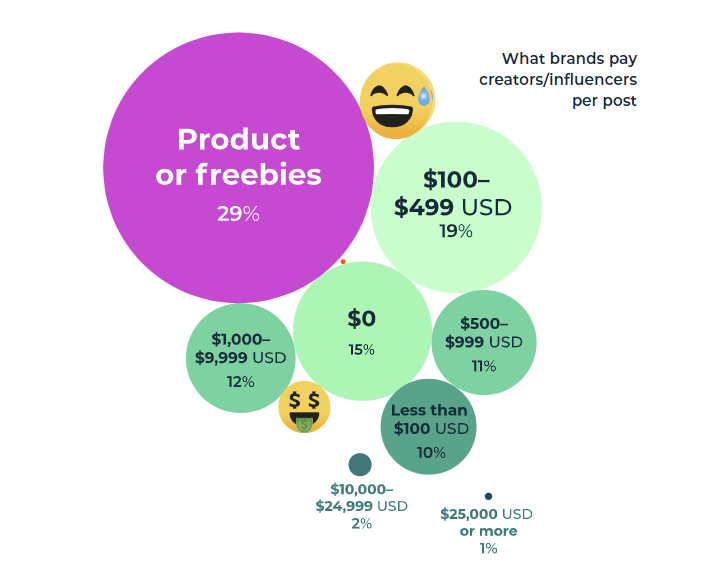
Hootsuite’s 2023 Social Trends report revealed that most influencers receive less than $100 per post.
- 29% receive payment in the form of products or freebies
- 19% are paid between $100 and $499
- 15% report receiving no payment for their posts
- 12% earn between $1,000 and $9,999
- 10% earn less than $100
- 2% receive payments between $10,000 and $24,000
- 1% are paid over $25,000
Email Marketing Statistics
The global email marketing market reached a value of $7.5 billion in 2020, and it is projected to grow to $17.9 billion by 2027.
This represents a CAGR of 13.3 percent during the forecast period.
Based on a study that has been monitoring email user statistics since 1993, the global number of email users is projected to reach 4.37 billion in 2023.
With a 2.7% growth rate compared to the previous year, the number of email users has surpassed half of the global population.
347.3 billion emails are sent on a daily basis in 2023.
According to HubSpot research, in 2021, 41% of email views originate from mobile devices, closely followed by desktop users, at 39%. The amount of daily emails is forecast to grow to over 392 billion by year-end 2026.
Regarding ROI, email marketing continues to dominate, with businesses earning an average of $40 for every dollar spent on email marketing.
Email marketing is the most effective sales-driving channel, with 55% of US consumers making a direct purchase after receiving an email. It outperforms banner ads by 139%.
In April 2023, the average open rate for emails across industries was measured at 34.46%.
Among various sectors, faith-based organizations recorded the highest average open rate of 44.11%, closely followed by childcare services at 43.87%.
Personalization and Emojis in Emails
The email’s subject line determines whether the recipient is attracted enough to open the email.
- 64% of recipients open an email based on the subject line.
- 69% of recipients categorize an email as spam upon seeing the subject line.
- 33% of recipients open an email because of a catchy subject lines.
Including the recipient’s first name in the subject line can boost open rates by 13% to 28%.
By personalizing email subject lines, open rates can jump by 50% and result in click-to-open rates that are 58% higher.
The use of emojis in email subject lines is a growing trend, as recipients are 8% more likely to open an email that includes emojis.
Businesses that incorporate emojis in the subject lines of their emails experience a boost in open rates, with 56% reporting an increase.
Top Performance Emails
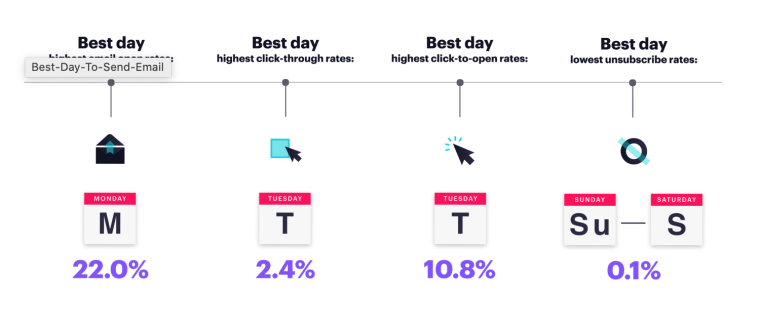
Campaign Monitor reported weekdays to have the highest engagement rate, accounting for 85% of the total weekly open rate volume and capturing nearly 95% of the weekly clicks.
The lowest engagement numbers fall on the weekend.
- Lowest email open rates: Sunday (20.3%)
- Lowest click-through rates: Saturday & Sunday (2.1%)
- Lowest click-to-open rates: Friday, Saturday, Sunday (10.1%)
Platforms for Email Marketing
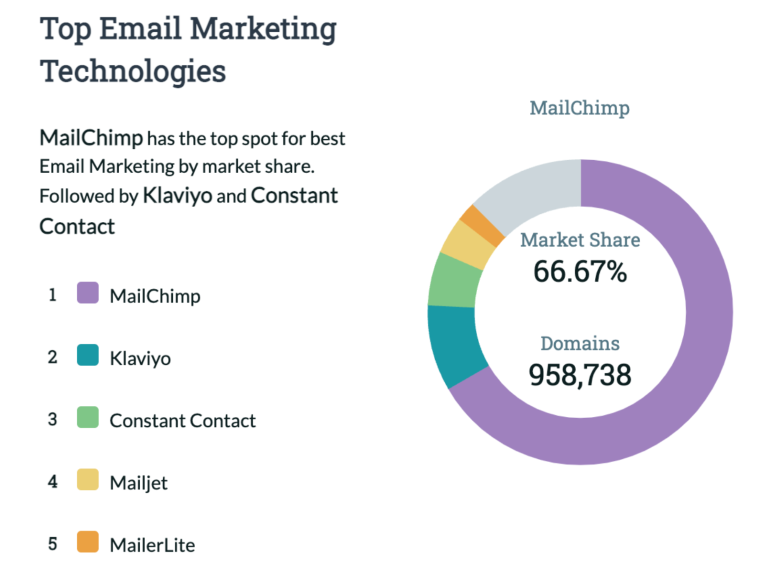
Mailchimp owns 66.67% of the email market share.
Email Marketing Demographics
99% of email users check their inbox daily, with some individuals checking as frequently as 20 times a day.
Among these users, a significant 58% of consumers prioritize checking their email first thing in the morning.
64% of Millennials consider email marketing to be the most personal channel.
This preference aligns with their behavior, as 59% of Millennials primarily use their smartphones to check their email.
Baby Boomers highly value email as a personal communication channel, with 74% of them believing it to be the most personal channel to receive brand communications.
Gen X follows closely behind at 72%, while 64% of Millennials and 60% of Gen Z share the same sentiment.
The Asia-Pacific region has the highest engagement rates for email marketing.
Affiliate Marketing Statistics
Global spending in the affiliate marketing industry is projected to reach $14.3 billion by 2023 and is expected to increase further to $15.7 billion in 2024.
The affiliate marketing spend in the US was expected to reach $8.2 billion by 2022, reflecting a significant increase from the recorded 5.4 billion in 2017.
As of March 2023, there were 9,600 affiliate-related services/companies operating worldwide.
Affiliate marketing contributes significantly to the digital revenue of top global businesses, ranging from 5% to 30%.
Amazon Associates was the first online affiliate marketing program in the world.
With a commanding marketing share of 47.80%, Amazon Associates dominates the global affiliate marketing industry. The program has over 900,000 affiliates that receive anywhere from 1% to 20% commission, depending on product type.
Other notable affiliate networks include:
- CJ Affiliate – 7.23% market share
- Rakuten Affiliate Network – 7.18% market share
- ShareASale – 6.75%
According to PayScale, the average annual earnings for an affiliate marketing manager in the U.S. is $61,748 in 2023.
The lowest 10% of affiliate marketers earn around $42,000 per year, while the highest earn $88,000 per year.
Working in Digital Marketing Data
Digital marketing roles encompass a diverse range of positions that play a crucial role in driving online growth, brand visibility, and customer engagement.
According to the Bureau of Labor Statistics, the demand for marketing professionals is projected to grow by 10% between 2021 and 2031, surpassing the average growth rate for all occupations.
As of June 2023, there are almost 500 million digital marketing jobs listed on LinkedIn globally. 108,900 of these digital marketing jobs are in the US market.
Using a database of 30 million profiles, Zippia released a list of demographics and statistics for digital marketing managers in the United States.
There are over 43,255 digital marketing managers currently employed in the US.
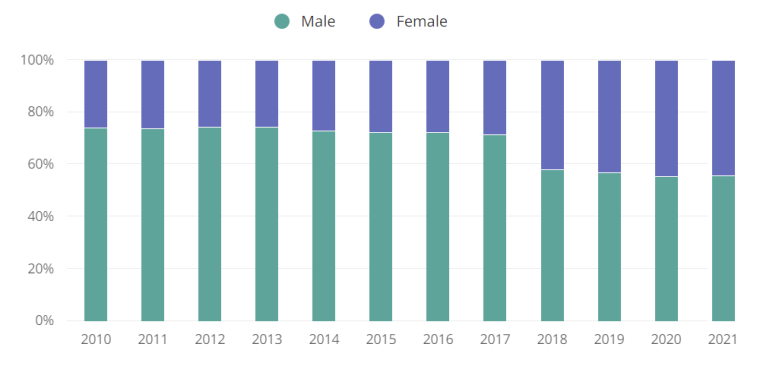
Women comprise 44% of all digital marketing managers, while men account for 56%.
The majority of digital marketing managers have a bachelor’s degree. The educational makeup in this role is:
- Bachelors, 77%
- Masters, 15%
- Associate, 6%
- High school diploma, 1%
- Other degrees, 1%
A female digital marketing manager earns 95¢ for every $1 earned by a male.
- $100,359 male income
- $95,489 female income
Other digital marketing job positions include:
| Job Title | Average Annual Salary |
| Content Writer | $41,437 |
| SEO Specialist | $57,609 |
| Social Media Specialist | $45,940 |
| PPC Specialist | $55,844 |
| Email Marketing Specialist | $69,052 |
FAQs
Is digital marketing in high demand?
Is digital marketing a fast-growing industry?
- Global Industry Analysts
- Research and Markets
- StrategyR
- Gitnux
- Data Reportal
- Similar Web
- Marigold
- Statista
- Business Adobe
- Simpli Learn
- Innovid
- Dhandho Karo
- Stratos Jets
- Content Marketing Institute
- Lucid Advertising
- Localiq
- eMarketer
- Amazon
- Bain & Company
- Statcounter
- Wordstream
- SEO Inc
- Search Engine Journal
- Poll The People
- High Visibility
- Social Insider
- GWI Social Trends Report
- Influencer Marketing Hub
- Radicati
- Optin Monster
- Invespcro
- Convince and Convert
- Knowledge Base
- MailMunch
- Omnisend
- Bluecore
- Datanyze
- PayScale
- Zippia
- Bureau of Labor Statistics

