Correlation analysis, sometimes known as bivariate analysis, is an analytical technique that investigates the relationship between two variables. With this tool, you can identify subtle patterns in the operations, gain a deeper understanding of the effects of your business strategies, and prepare for changes before they arise.
Here at Business2Community, we deliver practical resources to assist your business planning. In this article, we will get into correlation analysis to talk about its characteristics, applications, and limitations so you can master this technique with ease.
Correlation Analysis – Key Takeaways
- Correlation analysis evaluates the magnitude of the correlation between two variables with the strength of the relationship denoted by a correlation coefficient.
- This statistical method can identify hidden patterns/relationships you may have previously overlooked.
- Correlation analysis doesn’t consider the causation effects between variables, so other tools like regression analysis can bolster results.
What Is a Correlation Analysis?
Correlation analysis measures the simple linear relationship between any two variables such as independent variables or dependent variables to determine how they will react to a change together.
The relationship between two variables is denoted by a correlation coefficient, which gives a value between 1 and -1.
This correlation coefficient demonstrates the magnitude of the relationship. The greater the absolute values (closer to 1 or -1), the stronger the relationship.
A positive correlation suggests that as one variable increases in value, the other variable will increase too, and a negative correlation suggests otherwise. If your raw data points are correlated, then you can say that there is a linear relationship
When you begin your research, don’t confuse correlation with a causal relationship. While a correlation may suggest causation, it isn’t always the case.
For example, the sales of baby milk powder and pre-school enrollment rates are positively correlated. However, this doesn’t explicitly show causation between the two variables.
Who Needs to Do a Correlation Analysis?
Correlation analysis is one of the most powerful research methods for businesses. It can discover hidden or subtle correlations between two variables so your company can correctly target important elements in its operations.
Correlation analysis is a fundamental part of quantitative analysis. Statistical analysis is one of the first things business students learn at school and an important starting point for data analysts to dissect a large amount of data points.
Understanding how variables affect each other and the outcome is a crucial step for you as a decision-maker to conduct well-planned business operations. Adopting this technique can facilitate your market research process, allowing you to launch new products smoothly and refine your production flow.
Whether you’re a market analyst or a business owner, knowing how to interpret quantitative data can greatly scale up your production flow and spot potential problems before they arise.
To help you master this vital statistical method for your company, we’ll cover everything about performing a correlation analysis and real-life examples so you can utilize this tool successfully.
Regression vs. Correlation Analysis
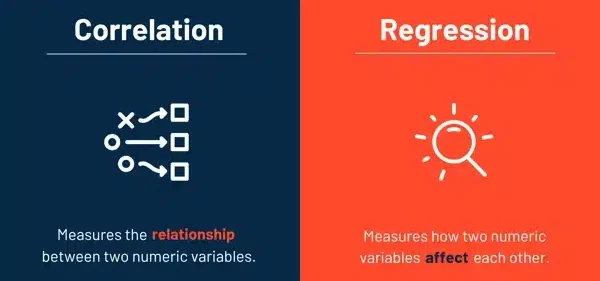
Both regression analysis and correlation analysis are used to study quantitative variables and their relationships. Correlation analysis shows the strength of a linear relationship while regression analysis uses an equation to show the relationship between variables.
With this method, users can predict the value of one factor if the other factor changes. Correlation analysis does not make predictions about the variables.
A regression analysis can also demonstrate the cause-and-effects between two quantitative variables, which is something correlation analysis does not offer.
Both analytical tools provide valuable insights about your production, guiding you in the right direction.
How to Perform a Correlation Analysis
Correlation analysis provides vital information about the relationship of two variables you’re interested in. Using this technique can boost performance and help structure your production flow better. To perform a correlation analysis, let’s first take a look at the key components involved. Then, we will deliver a step-by-step guide so you can master this method.
Key Components in a Correlation Analysis
The two most common types of correlation coefficients are the Pearson correlation coefficient, also known as Pearson’s correlation coefficient, and Spearman’s rank correlation, or the Spearman correlation.
A Pearson correlation coefficient is the most widely used method to determine the degree of relationship between two variables. An r-value is used to represent the correlation coefficient.
To use this technique, two assumptions must be met. There must be two continuous variables and a linear relationship between the variables.
The Pearson correlation coefficient formula is:
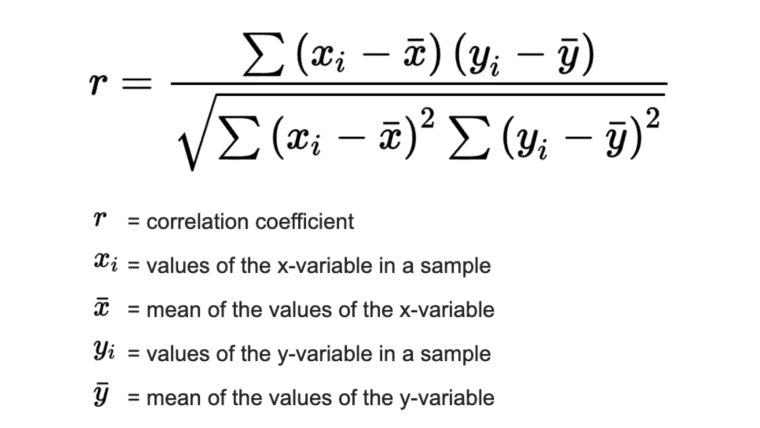
With the Pearson correlation formula, you will yield a result ranging from 1 to -1. If the result is close to 0, there is a low correlation between the two variables.
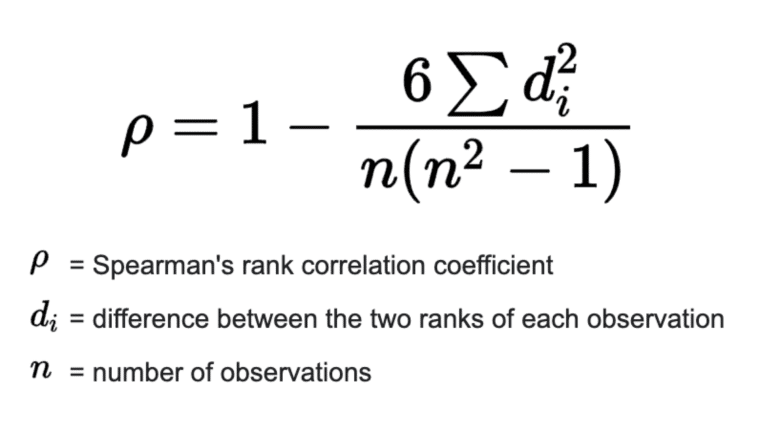
Unlike the Pearson correlation, there are no set assumptions for the Spearman correlation. The raw data points don’t have to follow a specific distribution. The results will also range from 1 to -1, with a greater positive value indicating a strong positive correlation. A greater negative value suggests a strong negative correlation.
To calculate the correlation coefficient, you need to create a table outlining the number of variables you have and rank them according to their proportion.
The Spearman correlation formula is:
Now that we’ve covered the key components of correlation analysis, it’s time to perform the analysis and interpret the results.
Most data scientists use statistical software programs to facilitate the calculation part and reduce the chances of human error. You can consider introducing digital tools into your research process to generate more reliable results.
Step 1: Collect Your Data
First, you need to decide on your scope of study and select an appropriate data collection method like surveys or sales records. When you’re collecting data, you should aim to survey as many people in your target pool as possible so the sample correlation coefficient is closer to the population correlation coefficient.
Random sampling is also important because it controls the standard deviations better and ensures the data is statistically significant. Biased data cannot accurately reflect correlations between variables.
Step 2: Plot Your Data Points on a Chart
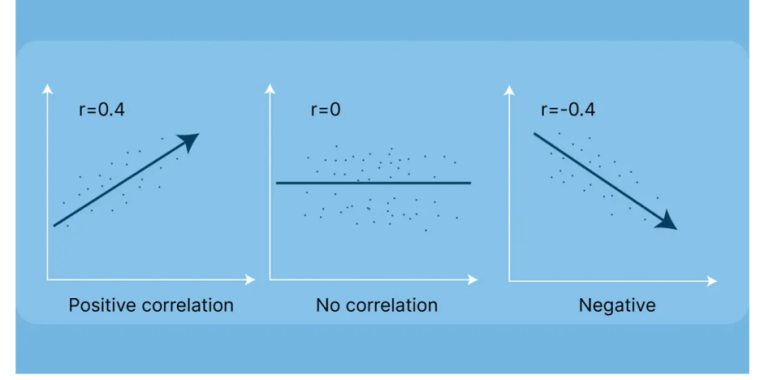
Once you’ve gathered the information, create a scatter plot with all the data. Most of the time, there is already a visible pattern between the variables on the graph. The distribution tells you if there’s a positive correlation or negative correlation between the two variables.
Step 3: Calculate Your Correlation Coefficient
Draw a straight line that goes through the center of the scatter plot. This line demonstrates the linear correlation you’re studying. There can be one or more outliers on the graph. It’s normal, as long as most dots are evenly scattered and form a pattern.
If you’re dealing with two continuous variables, you can use Pearson’s coefficient. Otherwise, you can use the Spearman coefficient to rank correlation.
We’ve covered the formulas for the Pearson correlation and the Spearman correlation, so you can calculate the appropriate correlation coefficient for your data set.
Step 4: Conduct a Significance Test
A hypothesis test, or a significance test, is a statistical tool that determines if your results are statistically significant. It examines your data to decide if there are significant correlations between the two variables or if the results are simply due to chance. It helps you draw a conclusion with more controlled uncertainty.
To conduct a significance test, you need to set a null hypothesis and an alternative hypothesis. The test looks at the sample correlation coefficient against the population correlation coefficient. A p-value is used to set the rejection zone.

If you can reject the null hypothesis, there are significant connections between the variables. This step validates your linear relationship results so you can present your findings with more confidence.
Step 5: Share the Results with Your Team
The last step is to share the results with your team members. You can look at the magnitude of the relationship and formulate strategies accordingly. Once you have the linear relationship, you can choose to work on one or both variables, depending on your needs.
If you have to study the linear association of various data sets, you need to conduct several correlation analyses to obtain the correlation coefficients and linear relationships.
Examples of Correlation Analysis
Correlation analysis penetrates most sectors in the business field. By learning about how one variable is related to another, you can be more aware of future changes and prepare your business accordingly.
Here are a few real-life applications of correlation analysis so you can see its effectiveness in the business context.
Example 1: Use Linear Relationships to Understand Consumer Behavior
You’re conducting market research to investigate actionable marketing plans about how having influencers in your online ads correlates to impressions. To map out the relationship between the two variables, you can use correlation analysis.
If there is a positive correlation, these two factors will rise and drop together. Depending on the magnitude of the correlation, you can start working on one variable to improve results cost-effectively. If you want to study more variables, you can create a few analyses to get their correlation coefficients.
Example 2: Use a Significance Test to Identify Effective Marketing Strategies
You’re studying behavioral sciences and want to understand how promotional discounts and sales volume are related. The correlation analysis informs you of a positive correlation. Now, you can test the relationship between two variables to further validate your research with a significance test.
If the result shows your data to be highly significant, there is a strong correlation between the variables. You can use the results to execute marketing strategies with greater confidence that they reflect reality.
Example 3: Use Correlation Coefficients to Find Out Operational Issues
HR managers often use correlation analysis to find out the correlations in different data sets like work hours and production levels, education, and salaries, to screen potential operational issues like unfair work treatment or uneven pay.
By dissecting the relationship between two variables, businesses can address the problems more easily. The correlations allow your company to execute a strategy fully knowing how it impacts another variable, and so reducing uncertainty.
How to Adjust a Correlation Analysis
When you use this technique for your business, you may find you want to adjust the analysis quite frequently. You may want to understand the effects of changing a business strategy and how it impacts the correlation between two variables, for example.
Let’s take Example 3 in the above section as a demonstration. After identifying the correlation between workspace per employee and production levels, you can try to change the magnitude of the correlation by assigning new office space.
Once you’ve made the changes, you can observe the new correlation to see if your changes have increased the correlation magnitude. If there has been a positive effect, you can decide to increase each team member’s workspace to further increase productivity.
When you want to control the outcome of a correlation analysis, you need to identify factors that impact the two variables.
To update a correlation analysis, you will need to calculate the new correlation coefficients with the new data. The calculation process becomes straightforward once you have familiarized yourself with the formulas.
Limitations of Correlation Analysis
Although correlation analysis is an incredibly handy tool in the research process, it comes with a few limitations that are important to understand. You need to be mindful of its weaknesses before adopting it into your decision-making process so you can make informed business decisions.
It Only Looks at Two Variables
Correlation analysis only studies two variables. It fails to look at the influence of multiple variables together. In real life, many variables are interlinked. A change in one variable means a change in a couple of others. Data scientists need to conduct multivariate analysis to further examine the relationships among multiple variables.
It Doesn’t Inform You About Causal Relationships
As mentioned, correlation analysis doesn’t consider the causation effects. Pinpointing correlations between variables doesn’t tell you about their cause-and-effect relationships. You need to do a regression analysis and other statistical analyses to break down the numeric causation effects.
It Doesn’t Explore Nonlinear Relationships Accurately
Correlation analysis can only explore linear relationships accurately. It’s one of the basic assumptions of this technique. If the correlations are not linear, this method generally can’t produce meaningful results and can mislead you.
The Value of Correlation Analysis
Correlation analysis reveals the strength of the relationship between two variables so you can formulate your business plans with full information on their effects on these elements. Utilizing this technique helps you discover hidden relationships in the operations you had not thought of.
It can take time to run through the process of correlation analysis – consider using technology to do the hard work for you. You can run the analysis regularly once you update processes or reallocate budgets to see if you can increase the link between variables, giving you more control over your business outputs.
Knowing the magnitude of their correlation helps you find the optimum point when choosing the best business plan. When conducting a correlation analysis, be aware of its limitations. It is best to use other analytical tools together to generate the most comprehensive results.

