Cohort analysis is a common tool used by businesses to gain targeted insights into consumer behavior. It monitors user activity over a set period to uncover hidden patterns. Using this method in your business helps you lower churn, improve services for your customers, and develop smarter strategies.
Our experts at Business2Community have prepared this beginner’s guide to cohort analysis so you master this simple technique and bring groundbreaking changes to your operations. From real-life examples to its limitations, here is everything you need to know.
Cohort Analysis – Key Takeaways
- Cohort analysis is a behavioral analytical tool that groups users with similar attributes together and tracks their user behavior.
- By tracking the user activity over a period, you can more precisely identify user retention issues and reduce churn.
- Cohort analysis can be time-consuming, so you should always incorporate other analytical tools to get an all-rounded view of your operations.
What is a Cohort Analysis?
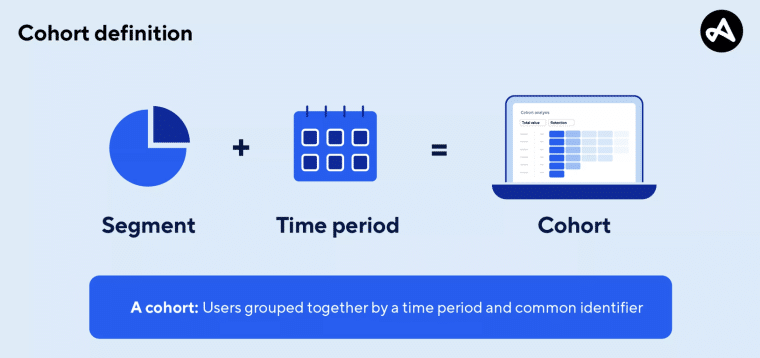
Cohort analysis is a form of behavioral analytics that groups relevant data with common characteristics and tracks their movements. A cohort refers to a group with shared user behavior within a defined time span, such as beta testers or a graduating class.
You can create different cohorts based on characteristics like acquisition date, retention rates, desktop users vs mobile users, or even vanity metrics to identify patterns in user behavior.
Separating user groups allows you to follow different cohorts to locate relevant patterns in the respective subset. It helps avoid producing misleading results from general analysis.
For instance, your sales report shows a 200% increase in purchases from last year, which looks good. However, most of the sales came from new customers, while your returning customers haven’t made as many repeat purchases as they used to. This could suggest that your marketing efforts are effective, but it might also mean that your product quality isn’t meeting expectations or that the overall customer experience is lacking.
Cohort analysis is a vital tool in analyzing your customer lifecycle. This technique allows you to target specific user groups and organize cohort data in a meaningful way. By studying how different users behave, you can gain a more accurate idea about your marketing efforts and the potential customer lifetime value.
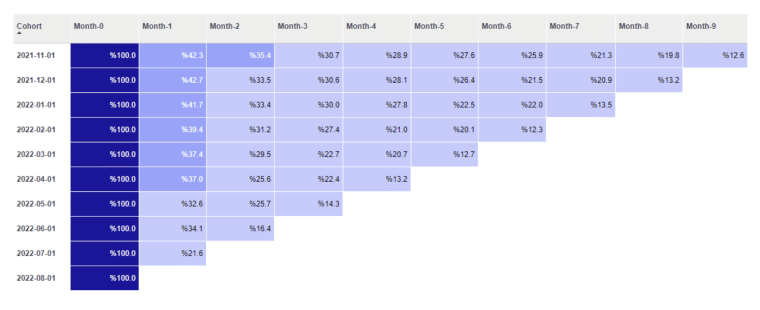
Cohort metrics offer actionable insights into your company’s promotional strategies so you can identify issues sooner and refine the user experience for consumers. Here’s an example of what a cohort table may look like.
Who Needs to Do a Cohort Analysis?
If you’re interested in delivering premium services to your customers, you can do so by observing how different user groups behave with cohort analysis. This form of business analytics helps uncover influential trends, benefiting a wide range of stakeholders in the business world:
- Stock traders and investors use cohort analysis to determine the holding periods of stocks and options to assess market confidence and potential market risks to make safer investment options.
- UX designers use customer retention cohort analysis to identify problems in the purchase process and increase customer retention.
- Marketers use cohort analysis to look at the engagement metrics in successful marketing campaigns to enhance the success rates for future campaigns.
- Sales managers use cohort analysis to evaluate sales performance, find out factors that influence the sign-up rates, and reduce churn rates.
How to Perform a Cohort Analysis
Unlike many statistical techniques with lots of equations and know-how to solve, cohort analysis is straightforward and rather simple. It’s suitable for new business owners without a mathematics background or a relevant degree.
Let’s take a look at how you can perform a cohort analysis in 5 simple steps:
Step 1: Define Your Goal and Choose Your Cohort Analysis Type
Having a clear goal is the first thing you need to do when carrying out a cohort analysis. All cohort analyses have specific cohorts that define the purpose of the study.
What are you trying to achieve with this cohort analysis? Are you trying to find the number of active users on your new app, the session duration of each visit, or the user engagement rates on your marketing channels?
From UX issues to retention problems, choose any question you want to address.
There are two common types of cohort analysis, namely acquisition cohort analysis and behavioral cohort analysis. Although the procedures for all types of cohort analysis are similar, defining your cohort analysis type can keep you on track with your goals and make your research more comprehensible to others. Here’s how they differ.
Acquisition Cohort Analysis
Acquisition cohorts track the life cycle of your new users to determine when they are churning. An acquisition can be anything from sign-ups to purchases to downloads. You can track the daily, weekly, and monthly cohorts to find out when your new users are leaving.
Acquisition cohort analysis is particularly useful in measuring the success of new product launches and marketing campaigns.
Acquisition cohorts offer a detailed look into your retention rates to shed light on potential problems. If the number of active users drops significantly during a specific period, you can investigate it further to see whether it is related to a change in market demand or your promotional campaigns.
Behavioral Cohort Analysis
While acquisition cohorts explain when something happens, behavioral cohorts try to explain why it happens. Behavioral cohorts study customer behavior to understand the reasons that lead to purchases.
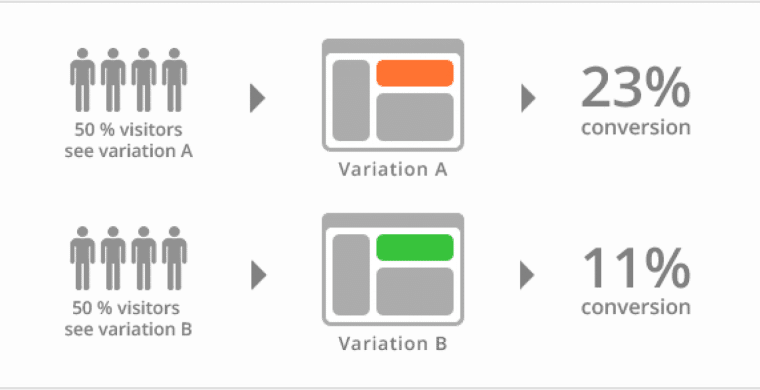
For example, suppose you are interested in knowing how different website layouts trigger purchase incentives. In that case, you can do an A/B test by offering two different purchase flows to different user groups and recording their respective purchase rates. Behavioral cohorts provide key insights about the user retention rate to reduce churn and are used for dissecting the motivation behind purchases.

Step 2: Determine the Cohorts and Collect Data
Next, you need to determine your cohorts based on shared characteristics. If you’re launching a new app and you want to measure retention rates over the first-year period, you can divide users based on the month they sign up and track their online activity until they abandon the app, i.e. they are no longer active on the software.
Data analytics tools like Google Analytics 4 are excellent sources for collecting accurate data. They can systematically present raw data gathered from users and categorize them into the appropriate cohorts.
Step 3: Create Cohort Analysis Charts
Once you’ve put your raw data into different cohorts, it’s time to create a cohort table. Let’s use an example of a cohort table created by Optimove to show you how a cohort table works.
The vertical axis shows the cohorts you created based on common characteristics, which is the acquisition date of the app in this case. The horizontal axis demonstrates user retention over the course of the study.
All the cells in the center represent the core features of the cohorts. They inform you about how users spend time on your app and their behavioral patterns during the study period.
For example, the row 2021-11-01 reveals the user retention rate over a 9-month period. After the first month, only 42.3% of clients remained active on the app. By month 3, the retention rate further dropped to 30.7% in this example.
Step 4: Identify Trends
Cohort analysis charts are great for identifying trends without needing complex calculations. Most of the time, a pattern is already visible on the cohort chart, revealing consumer behavior during that specific period.
Using the same cohort analysis example above, it can be seen that the further away from the launch date users signed up, the quicker they left the app.
Cohort analysis helps you figure out the potential culprit causing users to abandon your product. Perhaps the app never got updated to suit newer devices or the lack of marketing efforts since the launch led to confusion about its functions, which led to more users abandoning the app.
Step 5: Produce a Cohort Analysis Report
With the observations made from the cohort chart, you can create a cohort analysis report highlighting the possible problems and potential solutions to optimize customer retention. Discuss with your team about the strategies to enhance performance.
You can conduct an A/B test to determine the effects of different app layouts in this example, or different payment options, delivery choices, marketing methods, etc., have on on retention rates. With the new data, you can conduct another customer cohort analysis to see which strategy brings more desirable user retention rates.

Cohort Analysis Example
Cohort analysis allows you to decipher the true meaning behind a wide range of data points.
To illustrate cohort analysis’ value in the business context, we’ve created the following example detailing its benefits and usage.
Example: Use Cohort Analysis to Determine the Success of New Launch
You sell cryptocurrency mining equipment and are interested in knowing about the number of active users over a 5-week period.
Your goal is to understand activity rate for new users over time, you you choose to do an acquisition cohort analysis. Your different cohorts are determined by the date they bought a mining rig and SaaS subscription, aiming to highlight potential problems with your products.
Here is the cohort analysis chart:
| Cohorts | Week 0 | Week 1 | Week 2 | Week 3 | Week 4 | Week 5 |
| Oct 8 | 100% | 85% | 76% | 69% | 53% | 44% |
| Oct 15 | 100% | 88% | 82% | 65% | 57% | 55% |
| Oct 22 | 100% | 88% | 84% | 82% | 77% | 71% |
| Oct 29 | 100% | 93% | 89% | 81% | 80% | 75% |
| Nov 5 | 100% | 95% | 92% | 91% | 82% | 77% |
From the table, the trends you can see tell you that users were increasingly more willing to use your products as the churn rate continued to drop over the 5-week period. It may suggest good marketing efforts, great after-sale care, and satisfactory performance from your product. Overall, it can be concluded that the launch was successful.
Once you’ve completed your analysis, you should write a report and share it with stakeholders. This can ensure that everyone involved in your new product launch knows what went well and how they contribute to emulate future successes.
How to Adjust a Cohort Analysis
The purpose of cohort analysis is to reveal user behavior patterns and retention rates to facilitate strategic planning. While you may not get the results you were hoping for during your first analysis, you can use your results to make changes that should see your outcomes improve next time.
To adjust a cohort analysis, here are a few things you can do:
- Change your cohort size and date range. If your cohort size and date range are too small, it will be difficult to generate meaningful results that encapsulate your audience’s traits. While there is no agreed-upon rule on the cohort size, it will usually be easier to spot any pattern with a bigger sample size.
- Update your UX. When you’re looking at the churn rates, it’s important to adjust your production process to observe the effect on cohort analysis. It determines how well the adjustments/changes are working and if you should keep working in the same direction.
- Explore different marketing mediums. Depending on your audience, they may be more receptive to a particular marketing channel. You can adjust your marketing strategies and observe their effects on the cohort analysis results.
Limitations of Cohort Analysis
Cohort analysis lets you review the user behavior of different user groups at the same stage of their lifecycle to assess the effectiveness of your business tactics. Despite being a versatile tool for examining your marketing efforts, cohort analysis has its limitations.
When utilizing this technique, you need to be aware of its shortcomings to harvest the most accurate results.
It Can be Time-Consuming and Expensive
Even though cohort analysis is simple to use, monitoring user behavior over a long period of time can be costly, especially for small businesses without abundant funding. You may still need to outsource the task to professionals to process the large quantity of data points.
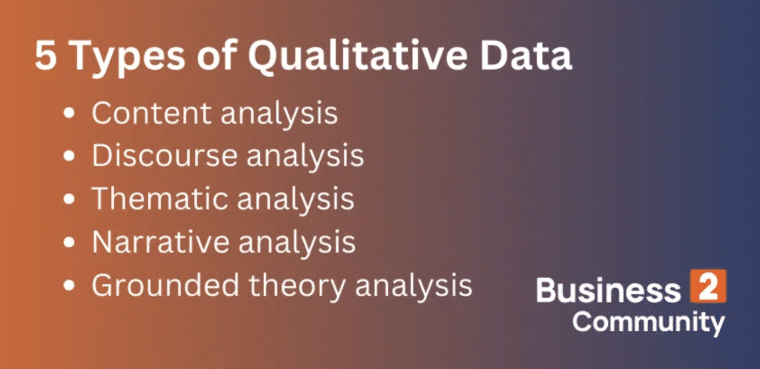
Also, the long observation period can lead to a lot of challenges. You can consider adopting other quantitative analyses and qualitative analyses to generate more timely results to cover your business needs.
It Doesn’t Explain the Reasons for Unexpected Results
Cohort analysis is a useful analytics tool that can highlight patterns in your cohort data, however, it fails to explain the causation effects. This technique doesn’t investigate the root causes leading to the formation of such a pattern. It can only show you the existing pattern in your data set.
Therefore, to enhance results, it’s essential to include other techniques like Pareto analysis and trend analysis to gain a deeper understanding of the business environment and opportunities.
It Doesn’t Set Comparable Benchmarks
Albeit being a potent tool in investigating your churn rate, cohort analysis doesn’t tell you what an acceptable churn rate is. It doesn’t provide comparable benchmarks or a general rule of thumb for you to work on.
You need to decide what is a “normal and healthy” churn rate, which can lead to human bias and inaccurate results. You can use competitors as standards but you should also still compare your to your own churn rates.
The Value of Cohort Analysis
In summary, cohort analysis is a helpful tool in identifying consumer behavior trends of specific user groups within a designated time frame. It tracks the customer lifecycle to optimize user retention and identify UX issues.
Being able to examine different cohorts prevents generalizing statistical findings. It provides a more realistic view of your performance and observes how various groups of users perceive your products/services.
By conducting cohort analysis, you can effectively locate successful business strategies that enhance user loyalty and generate more repurchases. This easy-to-use analytics tool doesn’t require complex calculations, which is favorable for small business owners to use as a starting point before further analyses.
Like all analytical tools, cohort analysis isn’t perfect. It has its weaknesses, which can hinder the precision of the results. To consolidate your findings, you should always incorporate other analytical techniques.


