Cluster analysis efficiently groups data points based on similarities and differences, unveiling hidden patterns and relationships. Whether you’re a business owner, manager, investor, or stock trader, cluster analysis aids in identifying trends, understanding data characteristics, and driving more informed decision-making.
To help you leverage the power of cluster analysis and unlock key strategic insights, we’ll be using our expertise at Business2Community to guide you through what you need to know about the technique, including a step-by-step process and a fleshed-out relevant business example.
Cluster Analysis – Key Takeaways
- Cluster analysis is a statistical analysis method that aims to group data points based on their characteristics such that objects in the same group (called a cluster) are more similar.
- By grouping similar data points you can reveal differences between them as well as hidden patterns and relationships in complex data sets.
- As it is exploratory in nature, cluster analysis has a wide range of applications in various fields, and can be combined with other analysis methods to unlock more strategic insights.
What is a Cluster Analysis?
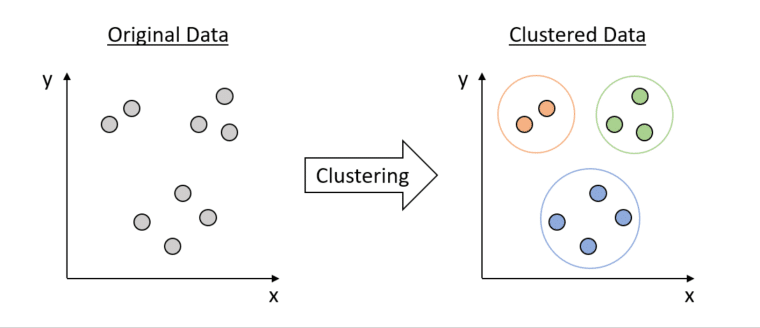
Cluster analysis is a multivariate data-mining technique powered by algorithms that places individual data points into clusters based on similarity, ensuring data points within each cluster are similar to each other (high intra-cluster similarity) and clusters that are distinct from one another (low inter-cluster similarity).
As an exploratory technique, cluster analysis searches for associations without predefined categories, providing insights to inform decision-making, strategic planning, and resource allocation.
Who Needs to do a Cluster Analysis?
Cluster analysis allows researchers and decision-makers to look for structures within data without being tied down to a specific outcome. This makes it a great technique for when you’re resolving problems related to data grouping.
Clustering has wide applicability, including market segmentation, social network analysis, and more. In business contexts, cluster analysis gives business owners, functional managers, and other stakeholders the insights needed to make data-driven decisions.
For example:
- Marketing and sales professionals use cluster analysis for market research, segmenting customers into groups based on their buying behaviors and informing marketing strategies for different clusters of customers.
- Financial analysts use various cluster analysis algorithms for segregating their customers into various risk categories, credit scoring, and detecting anomalies in financial transactions.
- Investors use clustering to group and assess various investment options.
- Stock traders use cluster analysis to build diversified portfolios, reduce downside losses, preserve capital, and minimize total risk.
How to Perform Cluster Analysis
To perform a cluster analysis, follow this 5 step process:
Step 1: Determine Your Objective
First, you need to clearly define the goal of your cluster analysis. For example, are you segmenting customers or identifying new market opportunities? Consider what issue you’re looking to investigate, the information you have access to, and how much it may cost you to get the information you need, such as conducting surveys.
Step 2: Select the Right Clustering Algorithm
Select the clustering algorithms that align best with your data and objectives. While there are over 100 different clustering techniques, the most popular clustering algorithms are:
K-means Clustering:
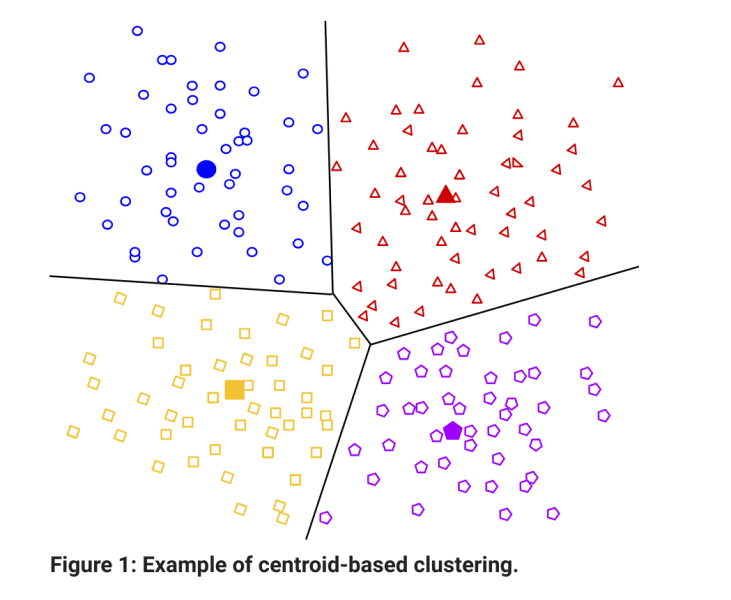
K-means clustering splits a dataset into a predefined number of clusters (k). The k-means algorithm works by selecting k cluster centers randomly as the initial guess. Each data point is then assigned to the closest cluster center, based on its Euclidean distance to these centers.
Through an iterative process, the k-means clustering algorithm adjusts the cluster centroid (the vector of means of the variables) of each group to minimize the total distance of points to their respective centers. This process continues until the initial clusters stabilize.
Due to its simplicity and effectiveness, the k-means algorithm is used in scenarios where data sets are large, well-defined, and need to be grouped into distinct categories. This makes it suitable for various applications, such as market segmentation or document clustering.
Hierarchical Clustering:
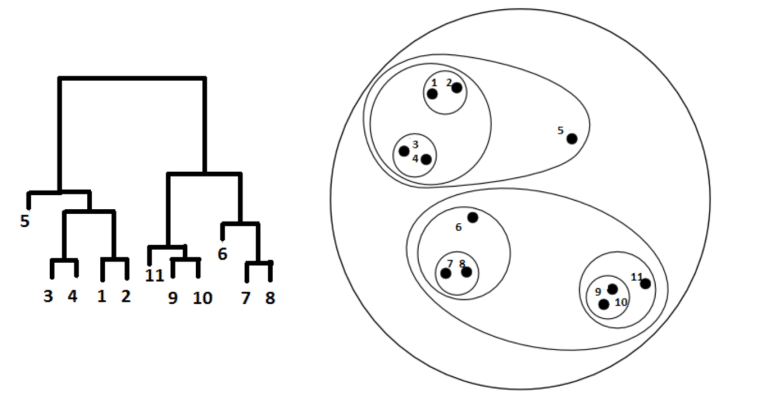
Hierarchical clustering is a cluster analysis algorithm that builds a hierarchy of clusters. Unlike k-means clustering, it has two distinct approaches and the number of clusters doesn’t need to be defined beforehand.
- Agglomerative clustering: A hierarchical clustering approach where each data point starts as a single cluster and similar clusters are merged step by step.
- Divisive hierarchical clustering: A hierarchical clustering approach where all the data points start in a single cluster and are then divided into smaller, more similar clusters.
Hierarchical clustering algorithms reveal the clustering structure and relationships among data points and variables, making it ideal for cases where relationship or hierarchy between clusters is important.
Density-Based Clustering:
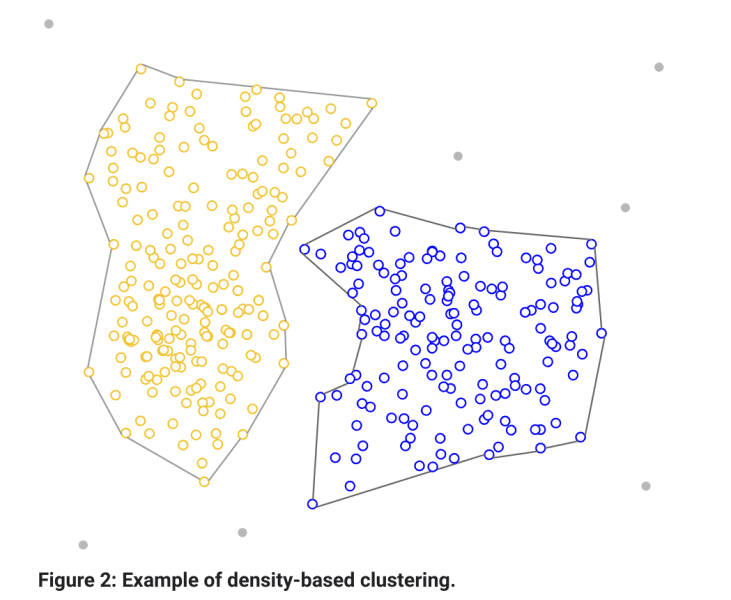
Density-based clustering is a clustering model that focuses on identifying clusters in a data space based on the density of data points.
Density-based clustering algorithms such as DBSCAN (Density-Based Spatial Clustering of Applications with Noise) recognize areas of high density as clusters, while low-density areas are regarded as noise or outliers.
This clustering structure is best suited for scenarios where you have anomalies or irregularities in the dataset or where differentiating between key data trends and less significant data points is important.
Step 3: Prepare Your Data
Preparing your data before performing cluster analysis is crucial and ensures a more effective clustering process. Start by cleaning the data, which includes handling missing values, removing duplicates, and dealing with outliers.
Next, normalize or standardize your data, as this makes variables comparable and prevents any single variable from disproportionately influencing the clustering outcome.
For high-dimensional data, apply dimensionality reduction techniques like principal component analysis (PCA) to simplify your dataset while retaining the most important features for analysis.
Step 4: Choose Distance Measures
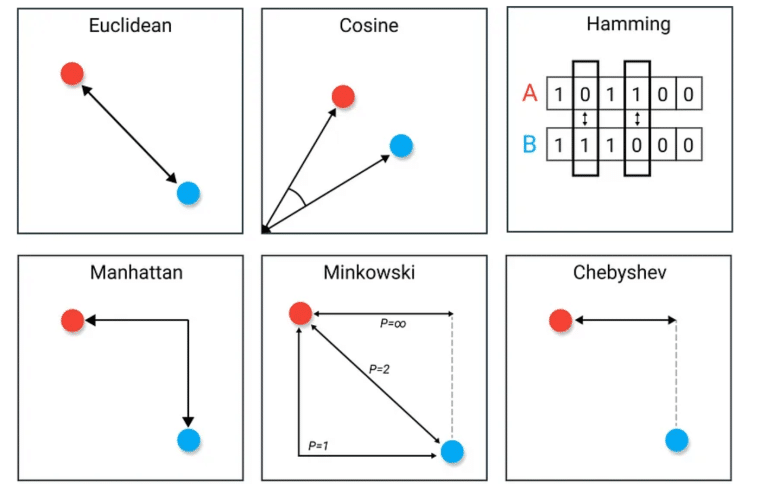
A distance metric is a measure of how far apart two data points are. It captures the different aspects of similarity or dissimilarity and can influence your clustering results. When selecting a distance measure, consider the nature of your data, the clustering algorithm you plan to use, and the specific characteristics of your dataset.
- Euclidean Distance: The straight-line distance between two data points. Best suited for k-means clustering when dealing with continuous data.
- Squared Euclidean Distance: Similar to Euclidean Distance but it squares the distance. Suited for emphasizing larger differences between data points in k-means clustering.
- Average Distance: A general-purpose metric that averages the distances across all dimensions.
- Manhattan Distance: The sum of absolute differences between data points in all dimensions. Best for high-dimensional data.
- Cosine Distance: Calculates the cosine of the angle between two vectors. Ideal for text clustering in algorithms as it focuses on the orientation of the data points rather than their magnitude.
- Hamming Distance: Compares binary data and is well-suited for algorithms that work with categorical data, like hierarchical clustering.
Step 5: Conduct and Evaluate your Analysis
Run the chosen algorithm on your dataset, keeping in mind that an effective clustering algorithm will create separate clusters that are different from each other. If your data points end up in a single cluster, your data is extremely similar and you’ll need to try other clustering methods to find distinct groups.
The following internal and external evaluation metrics can help you validate the accuracy and effectiveness of different clustering algorithms:
Internal Validation Metrics
- Silhouette coefficient: Measures how similar an object is to its own cluster compared to other clusters.
- Davies-Bouldin index: Evaluates the compactness and separation of clusters, with lower values representing well-separated clusters.
- Calinski-Harabasz index: Measures the ratio of inter-cluster distance to intra-cluster distance with higher values indicating well-separated and compact clusters.
External Validation Metrics
- F-measure/F-score: Determines the accuracy of a clustering algorithm by checking its precision and recall.
- Purity: Evaluates the share of data points that are correctly placed in a particular cluster.
- Rand index: Compares the predicted groupings from the clustering to the true groupings, with higher values showing better match.
Step 6: Interpret and Apply your Findings
Once you’ve analyzed and evaluated your findings, consider how the characteristics of each cluster relate to your objective. Use these insights to drive better decision-making or strategy development. Then, based on the results and feedback of any strategies you implement, adjust your approach or parameters.
Example of Cluster Analysis
Below, we explore a very simple example of cluster analysis, so you have an idea of how it works in a business context.
Customer Segmentation in a Retail Store
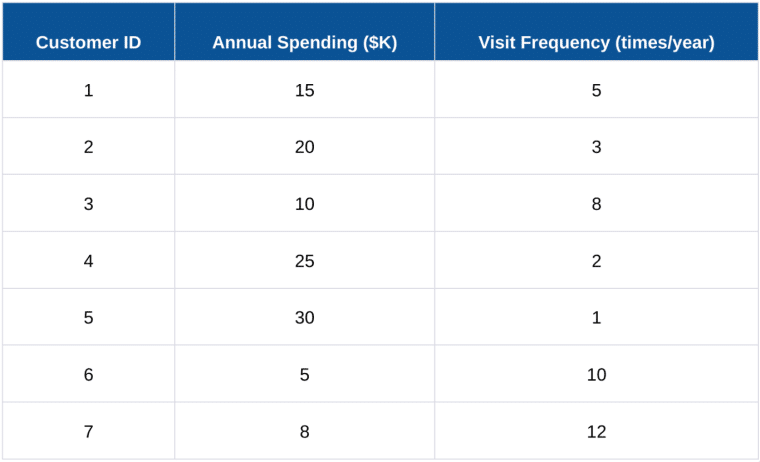
A retail store owner wants to segment customers better for targeted marketing. As shown in the table below, the store has collected data on two key attributes: annual spending and visit frequency.
Select the Number of Clusters (k): The owner chooses k = 2 for simplicity.
Select Initial Centroids: The owner randomly selects two customers as the initial centroids.
Calculate Distance and Assign Clusters:
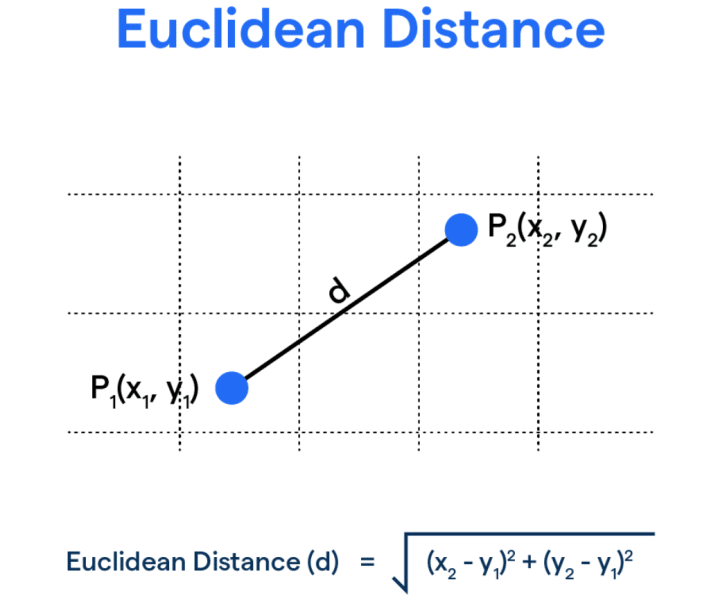
Based on Euclidean distance, the owner assigns each customer to the nearest centroid. The Euclidean distance between two points (x1; y1) and (x2; y2) is:
Recalculate Centroids: The owner recalculates each cluster centroid as the average of its assigned customers.
Iterate: The owner repeats the process of assignment and centroid recalculation until the clusters stabilize.
After performing the clustering, the results are as follows:
Centroids of Clusters:
- Centroid 1: Average Annual Spending $25,000; Average Visit Frequency 2 times per year.
- Centroid 2: Average Annual Spending $9,500; Average Visit Frequency 8.75 times per year.
Cluster Assignments:
- Customers 2, 4, and 5 are in Cluster 1 (lower visit frequency, higher spending).
- Customers 1, 3, 6, and 7 are in Cluster 2 (higher visit frequency, lower spending).
Interpretation:
Cluster 1 (High Spending, Low Frequency)
These customers spend more per visit but visit less frequently. Marketing strategies could include promoting high-value items or loyalty programs to encourage more frequent visits.
Cluster 2 (Low Spending, High Frequency)
These customers visit more often but spend less. Strategies might focus on promotions or discounts on frequently purchased items to increase spending per visit.
When to Use Cluster Analysis
Key examples of when to use cluster analysis include:
Market Segmentation
Cluster analysis is a crucial tool for segmenting markets. It allows businesses to categorize customers by purchasing habits and demographics, leading to more targeted marketing and product development.
Risk Management
In risk management, cluster analysis can be used to classify loan applicants into risk groups based on credit history and income, aiding in risk reduction and informed lending decisions.
Supply Chain Optimization
Cluster analysis can play a vital role in supply chain management. It can help manufacturers categorize suppliers by delivery efficiency and quality leading to improved supply chain efficiency.
How to Adjust a Cluster Analysis
To adjust your cluster analysis for more accurate and actionable insights:
- Use high-quality data and select features, variables, and algorithms that align with your business objectives.
- Adjust parameters such as distance metrics to better capture finer details in your data.
- Adjust your data clustering approach to uncover the most meaningful and actionable insights.
Limitations of Cluster Analysis
While cluster analysis is a powerful way to identify groups and the underlying structure of the data, it has certain limitations.
Subjectivity
Interpreting the clusters relies heavily on you as the researcher or analyst. This introduces a degree of subjectivity that can significantly affect outcomes. To address this limitation, consider using regression analysis, which quantifies the relationships between variables, to provide more objectivity.
Oversimplification
Cluster analysis provides information about associations and patterns that exist in data, but not what they are or what they mean. In complex datasets where variables are interrelated, clustering might oversimplify these relationships. Incorporate factor analysis to reveal more nuanced groupings or relationships than those identified by cluster analysis alone.
The Value of Cluster Analysis
Cluster analysis is a powerful tool for grouping data points into categories based on their similarities or differences, revealing patterns and relationships that may not be immediately obvious. Professionals in many fields leverage clustering to unearth strategic insights and inspire innovative solutions.
Whether it’s identifying market trends or understanding customer preferences, use cluster analysis and its exploratory approach to dive into your data. Not only will this give you an edge in the marketplace — it will provide the necessary insights to boost operational efficiency and optimize resource allocation.
Cluster analysis has inherent limitations. To address them while ensuring robust, actionable insights that unlock relationships and patterns in your data, integrate it with tools like regression and factor analysis.
