Staying ahead of the curve in business intelligence is key for small to medium-sized enterprises striving for growth and success. As a business owner or operations professional, having insights into the most important business intelligence trends is like having an armory of secret weapons. It empowers you to unlock the true potential of your data, driving tangible value for your business in today’s ever-changing market.
Focusing on high-quality data, this compilation of business intelligence trends, handpicked by our experts at Business2Community, is your trusted guide to making well-informed decisions and charting a course toward greater achievements!
Key Business Intelligence Trends
- The global business intelligence market is set to reach $54.27 billion by 2030.
- 80% of corporate strategists see data analytics, AI, and automation as pivotal aspects of business intelligence for their success.
- 60% of businesses leverage infographics in their data visualization strategies.
- 94% of business leaders use cloud services for their technology initiatives.
- On average, companies employ 3.8 BI solutions.
What are 2025’s Business Intelligence Trends?
In 2022, the global business intelligence industry was valued at $27.11 billion. It is anticipated to experience substantial growth, with projections indicating an increase from $29.42 billion in 2023 to an impressive $54.27 billion by 2030.
Considering that surging number, let’s explore the top trends to understand how businesses can align their operations with this dynamic market.
1. Using AI for Business Intelligence Enhancement
Artificial intelligence (AI), machine learning (ML), and natural language processing (NLP) are the hottest business intelligence trends because they have revolutionized the way businesses and data scientists analyze data.
In fact, according to a 2023 survey by Gartner, 45% of over 1,400 executive leaders are in the pilot phase for generative AI, while an additional 10% have already implemented generative artificial intelligence solutions.
Back in 2017, only 20% of organizations reported incorporating artificial intelligence in any business area, as per McKinsey. Fast forward to 2022, this number had grown to 50%.
By 2028, conversational user interfaces powered by generative AI sales technologies will account for 60% of B2B seller tasks, a substantial increase from the less than 5% observed in 2023.
For example, chatbots on websites, virtual assistants like Siri and Alexa, and automated customer support systems use natural language processing artificial intelligence for seamless conversations.
2. Improving Business Intelligence Operations Through Automation
AI-powered automation is a game-changer for SMBs, handling repetitive, time-consuming tasks and freeing up human resources for more strategic activities. McKinsey’s research indicates that implementing automation, especially through advanced technologies like generative AI, can significantly streamline work processes.
This, in turn, may lead to a substantial reduction in the time spent on manual tasks, which can make up a significant portion of employees’ work hours, ranging from 60 to 70%.
Generative AI could lead to a growth of 0.1 to 0.6 % annual labor productivity by 2040. When integrated with other technologies, including generative AI, work automation can contribute an annual increase of 0.2 to 3.3 percentage points to productivity growth.
In fact, AMD has reported that 90% of organizations implementing AI have reported improved employee efficiency.
Additionally, new AI technology can effectively address operational issues, especially concerning data security and efficiency. Seven in ten business leaders are confident that AI can enhance the automated detection capabilities of cybersecurity threats.
3. Leveraging Predictive Analytics in Business Intelligence for Actionable Insights
Predictive analytics, a subset of AI, enables SMBs to forecast customer behavior and future trends based on historical data. This capability is invaluable for inventory management, sales forecasting, and resource planning.
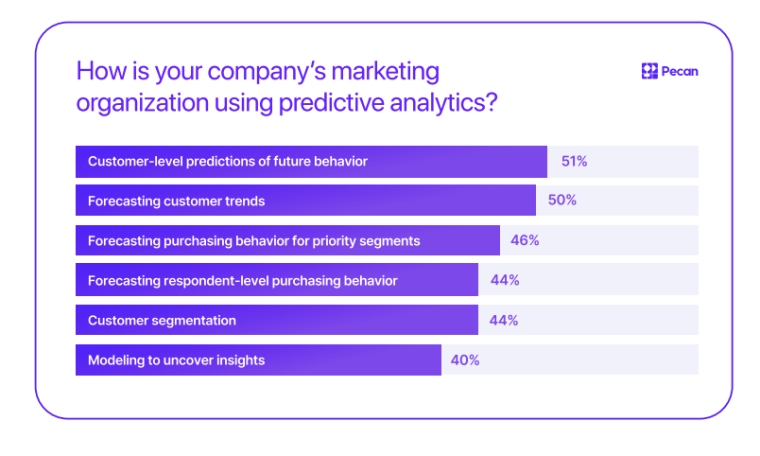
According to a survey by Pecan of 250 US marketing executives at companies with a minimum annual revenue of $100 million, 88% use predictive analytics to forecast customer purchasing behavior.
4. Customizing Business Intelligence with AI Personalization
Over 92% of businesses are employing AI-powered personalization strategies to fuel growth in their operations, according to a 2023 Twilio report. AI-driven personalization allows SMBs to tailor their products and services to individual customer preferences.
This not only enhances customer satisfaction but also drives revenue growth. In fact, 56% of consumers are more likely to purchase if offered a personalized experience.
For example, the premium outdoor brand Norra developed a comprehensive recommendation platform, covering everything from data collection to deploying machine learning predictions within six months. This innovative recommendation engine resulted in a remarkable 50% increase in conversions for the brand.
Many businesses are determining what constitutes success in the realm of AI-driven personalization using data. This process involves experimenting with different approaches, analyzing results, and refining their personalization efforts to align with their specific goals and objectives.
5. AI and Augmented Analytics in Data Analytics and Data Management
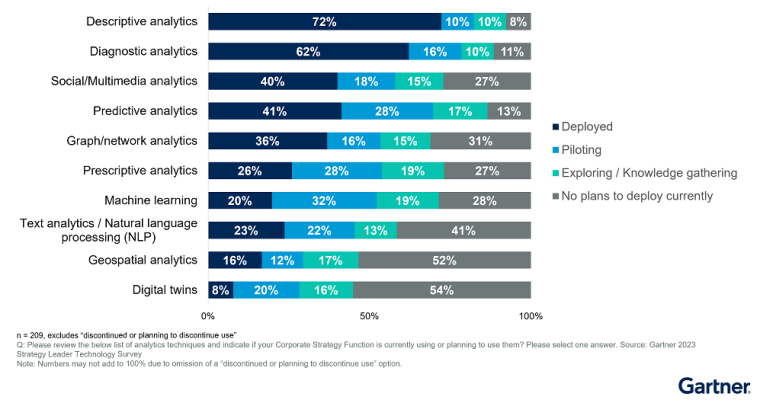
According to a 2023 survey by Gartner among 200 corporate strategy leaders, nearly 80% of corporate strategists believe that technologies like data analytics, artificial intelligence, and automation will be crucial in their success in the next two years.
Furthermore, about half of their strategic planning and execution tasks could be partly or fully automated, although only 15% are automated as of 2023.
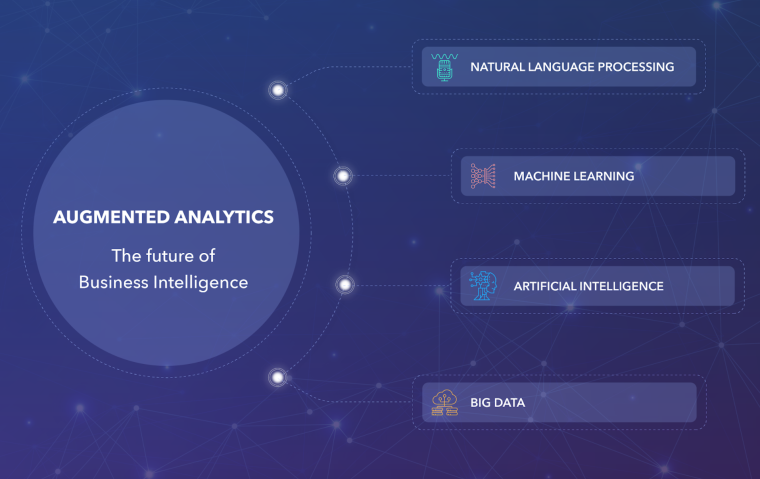
Augmented analytics (AA) leverages machine learning and AI techniques to transform how businesses handle data preparation, analysis, and visualization, facilitating a quicker, more informed, and data-driven decision-making process.
Leaders in data and analytics should embrace AA as technology advances to enhance their processes further.
In 2022, the AA market size was valued at $15.84 billion globally, with North America accounting for $5.89 billion of that total. Looking ahead, the projected growth of the global augmented analytics market is significant, expected to increase from $18.68 billion in 2023 to $66.54 billion by 2030, with a CAGR of 19.9%.
Augmented analytics streamlines the process of extracting insights from data, making it more accessible, accurate, and timely. This empowers you to make better decisions that are grounded in data-driven intelligence.
It offers benefits such as:
- Automated data preparation
- Natural language processing
- Smart insights and recommendations
- Advanced visualization
- Predictive analytics
- Anomaly detection
- Reduced bias and error
- Time efficiency
- Accessibility to data-driven insights
In augmented analytics, ML learns from data, NLP helps people talk to computers in a friendly way, and automation does a lot of the work behind the scenes. This makes it much easier for business users to use data to make smart decisions!
Machine learning is like a smart assistant for data. It helps analyze information and find important patterns without being told exactly what to look for. It learns from data, making it better at its job over time.
On the other hand, natural language processing is similar to a language translator, but in this case for computers. It helps computers understand and communicate with humans in a more natural way, like having a conversation.
In augmented analytics, getting data generated with these AI tools to create reports is largely automated ready and creating reports.
As an example, augmented analytics yields substantial benefits in the healthcare sector, including:
- Predict patient outcomes using historical data
- Optimize resource allocation
- Aid in early detection of diseases
- Analyze patient responses to different medications to optimize treatment plans
- Remove bias
- Forecast patient admission rates
- Reduce manual labor
For example, UnityPoint Health implemented augmented analytics using AI business intelligence tools that integrated chronic health data, social data, and risk assessments for hospital admission and readmission.
This allowed them to accurately categorize patients and foresee those with a high risk of unnecessary healthcare utilization. Over 30 months, they achieved significant results, including:
- $32.2 million spending reduction
- 54.4% decrease in hospital admissions
- 39% drop in ED visits
6. Ethical Data Governance in Business Intelligence
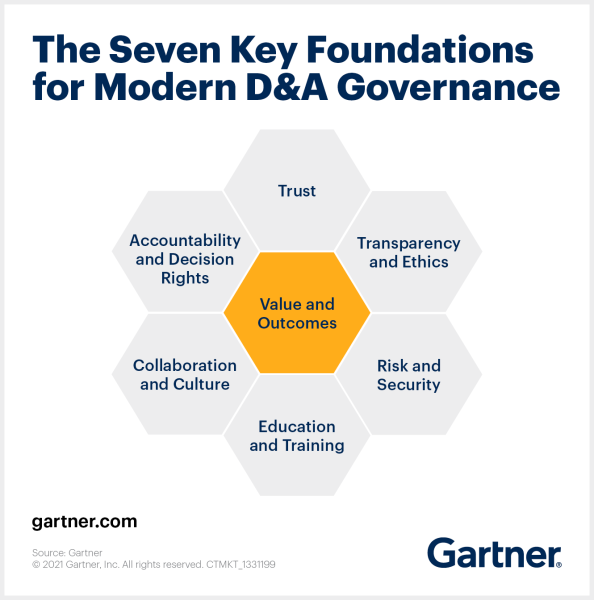
Data governance has become an essential pillar for SMBs in business intelligence striving for efficient and data quality management. Effective data governance and data security helps organizations:
- Make informed decisions.
- Improve operational efficiency.
- Build trust with stakeholders by demonstrating a commitment to responsible data management.
By 2025, individuals and businesses will generate approximately 463 exabytes of data daily worldwide. This marks a substantial increase from just three exabytes a decade earlier.
Consequently, the surge in data production emphasizes the importance of having strong and expandable data storage solutions to manage the increasing volume of information generated by individuals and businesses.
In a 2022 Gartner survey, 61% of participants emphasized the importance of enhancing data for business processes and productivity through their data governance goals.
Surprisingly, only 42% of this group felt confident about their current progress in achieving this objective. This highlights a significant gap between their intended goals and the actual progress in their data governance efforts.
Gartner experts foresaw a potential challenge for organizations aiming to expand their digital operations. They predicted that by 2025, as much as 80% of these organizations may face difficulties if they don’t adopt a more modern approach to data management.
7. Data Quality Management Needs to Improve
A 2021 McKinsey Global Survey exposed a notable deficiency in handling data biases and governance, recognizing equity and fairness as pivotal AI risks in organizations. Out of 1,000 respondents only:
- 27% actively checked for biased data during ingestion.
- 17% had a dedicated data governance committee.
- 30% recognized equity and fairness as critical AI risks.
The regulatory landscape emphasizes the paramount importance of complying with data privacy laws such as GDPR and CCPA. In 2020, Gartner predicted that by 2023, 65% of the world’s population would have their personal data covered under modern privacy regulations.
This represents a significant jump from the 10% reported in 2020. It also highlights a worldwide business intelligence trend towards prioritizing individual privacy, as numerous countries implement regulations resembling the General Data Protection Regulation (GDPR) as the prevailing standard for managing personal information.
The California Consumer Privacy Act (CCPA) is a pivotal response to the pressing concerns surrounding privacy and data protection in the United States. In fact, 42% of US consumers have expressed worry about digital privacy.
This landmark legislation empowers individuals by granting them greater control and transparency over their personal information in the face of escalating data collection practices by businesses.
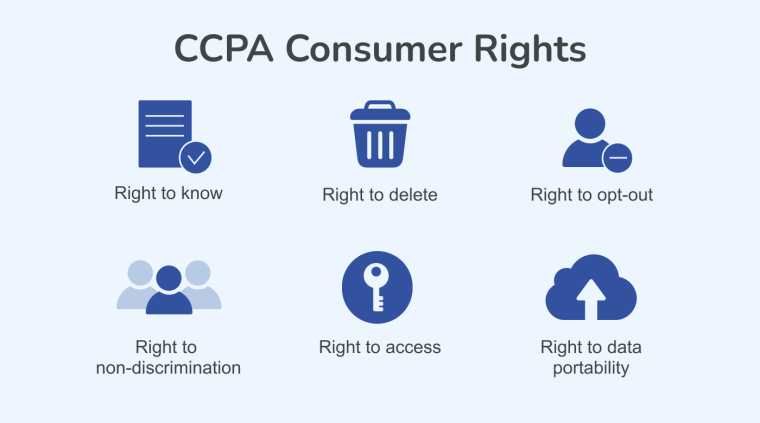
The CCPA gives people six important rights related to data security, providing valuable guidance for businesses on law implementation.
Businesses worldwide must focus on robust data governance, ensuring clear documentation and comprehension of internal data processes. This involves auditing information collection, storage, and usage.
Although it may seem like an added effort, it fosters consumer trust, allowing organizations to offer tailored products and services at accessible prices.
8. Data Storytelling and Insightful Data Visualizations are Vital
According to professionals at Salesforce, data storytelling in the business intelligence industry refers to the practice of using data and analytics to convey a narrative or message.
Integral to this process is data visualization, which streamlines information, highlights insights, engages the audience, and supports the narrative, promoting transparency and adaptability to diverse audiences.
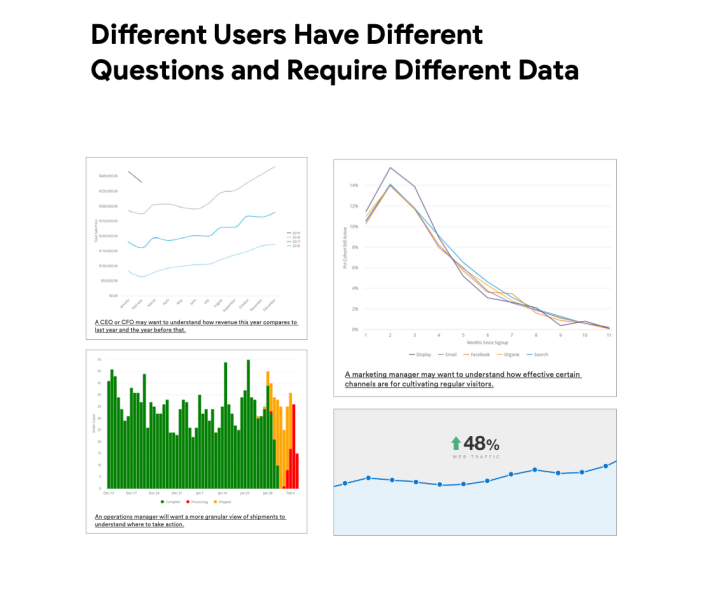
Additionally, data visualization can help adapt to different audiences, making it a powerful tool for conveying information clearly and effectively. Therefore, it’s important to understand the goals of your viewers when choosing visualization.
For example, executives and strategists seek insights on top-performing products. Whereas marketing teams want consumer behavior insights for precise campaign targeting.
- Discover patterns
- See trends
- Digest large amounts of data
- Gain useful and actionable insights
In fact, as per a report from Google, data science findings from Harvard’s Department of Psychology indicate that:
- 50% of the cerebral cortex is for visualizing.
- The brain can process 60,000 images, with a significant part of the cerebral cortex dedicated to visual analysis.
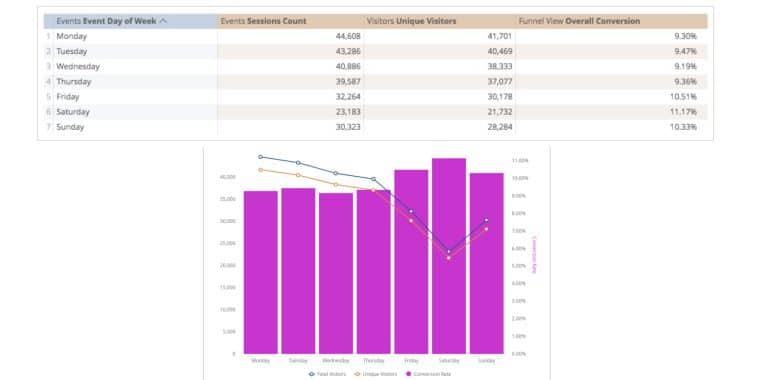
Consider this example: when comparing the chart and the graph below, which visually allows you to quickly determine the day with the lowest number of site visitor sessions?
9. Data Scientists Are Using Infographics for Data Visualizations
Infographics are a visual form of data storytelling, offering a quick and visually appealing way to convey information.
Based on insights from SEO experts, a significant 60% of businesses have leveraged infographics in their data visualization strategies. This trend may be attributed to the following reasons:
- Infographics are 30 times more likely to be read than an article.
- The drive to read increases by 80% with an infographic.
- Infographics generate 45% more clicks on links with infographics.
- Infographics in blogs/articles result in up to 178% more inbound external links.
According to Microsoft, for effective data storytelling and visualization, three crucial elements work in tandem:
- Narrative
- Visuals
- Data
Your narrative provides the business context and structure, supported by data-driven insights. Visuals like charts and graphs illuminate hidden insights and reinforce your theory.
Integrating narrative, visuals, and data fosters an emotional response, influencing decision-making and driving organizational change.
Further, compelling data storytelling and data visualization can drive action and bring various advantages such as:
- Enhance the value of your data and insights.
- Simplify complex information to highlight key points for your audience.
- Add a human touch to your data.
- Deliver value to your audience and industry.
- Establish credibility as a thought leader in your field.
With over 1.2 trillion searches conducted annually worldwide, Google employs data storytelling in its Year in Search campaign. The annual campaign analyzes trillions of search queries, organizing insights and delivering them through an engaging video format.
This effectively captivates the audience, offering them valuable information in an accessible and compelling manner.

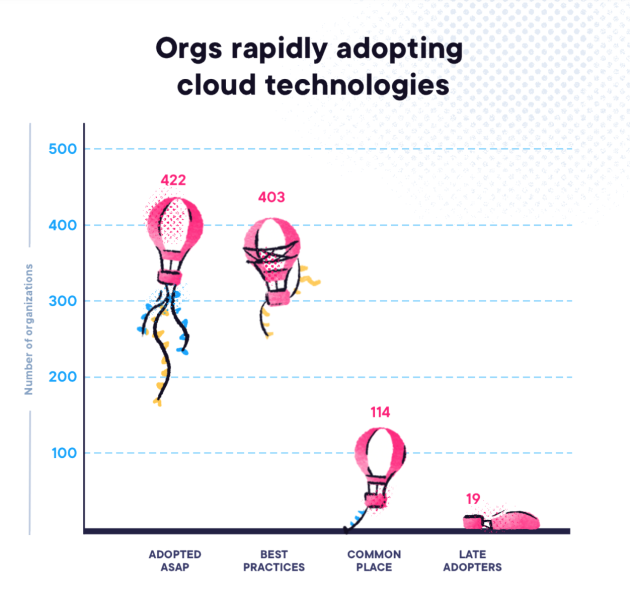
10. Cloud-Based BI Solutions Are Seeing Quick Adoption
Cloud-based business intelligence solutions refer to business intelligence platforms and tools that are hosted on cloud infrastructure and accessed over the Internet.
As of 2023, 94% of leaders use cloud services for their technology initiatives. These solutions allow organizations to store, analyze, and visualize data in the cloud, eliminating the need for on-premises hardware and providing flexibility and scalability.
Business users can access BI dashboards and reports from various devices, enabling remote access and collaboration. The cloud has become a standard practice, with 70% of organizations stating that over half of their infrastructure is cloud-based.
Additionally, 49% of them are actively in the process of migrating more of their data to the cloud. However, the current trend in cloud-based BI solutions is not just about migration but rather the swift adoption of new cloud services.
The connected cloud trend in business intelligence signifies the growing reliance on cloud-based BI solutions and the integration of multiple cloud platforms. This emphasizes the interconnectedness of various cloud services for streamlined data access, processing, and data analysis, ultimately enhancing business intelligence capabilities.
As a matter of fact, over 65% of organizations operate in multi-cloud environments, and about 20% are actively pursuing the incorporation of an additional cloud platform into their existing environment.
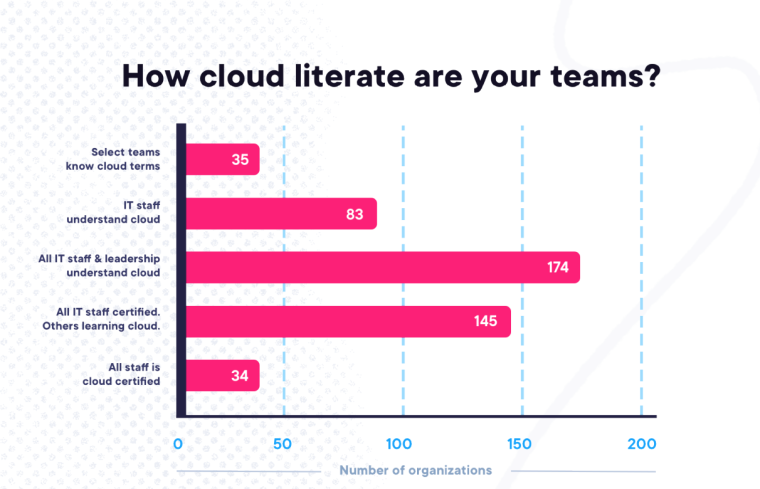
While many organizations are considering multi-cloud solutions, some may struggle to achieve optimal performance without the necessary expertise, processes, and infrastructure. For that exact reason, cloud and data literacy is important.
11. Cloud Data Literacy in Sharp Focus as Budgets Increase
A survey conducted by Plural Sight found that nearly 50% of global leaders across various industries adopt the latest features and services provided by cloud providers upon their release.
Businesses must make cloud training available to various staff members for successful and smooth cloud adoption. In fact, most organizations (62%) limit cloud training to technical teams like data scientists, which may slow their progress toward becoming fully cloud-native.
Despite economic challenges, 40% of organizations plan to increase their spending on application modernization and adopt cloud analytics platforms.
This spending number will reach about $1.2 trillion for public cloud services by 2027. Furthermore, 71% of leaders plan to increase their cloud budgets for 2024.
For business intelligence, this implies a greater reliance on cloud-based solutions for data storage, processing, and analysis. It also suggests that organizations will likely adopt advanced analytics and data-driven strategies to maximize their cloud investments.
As cloud computing adoption continues to surge, it stands out as one of the top business intelligence trends. This shift signifies a significant transformation in how businesses approach and utilize technology to enhance their operations and decision-making processes.
Netflix’s adoption of AWS is a prime example of how cloud computing has revolutionized how businesses operate and utilize business intelligence.
Netflix relies on AWS for the majority of its computing and storage requirements. In total, these operations involve over 100,000 server instances on AWS. This includes:
- Databases
- Analytics
- Recommendation engines
- Video transcoding
For example, amid the COVID-19 pandemic, Netflix’s in-house VFX team completed over 600 shots for “The Crown” Season 4 in just 8 months, using a cloud-based workflow on AWS. All work was done remotely, showcasing the efficiency of cloud technology in content production.
The Future of Business Intelligence
Business intelligence is undergoing a significant transformation, becoming increasingly essential for businesses. With the advent of artificial intelligence and machine learning, data analysis is informative and actionable, empowering organizations to make decisions that drive growth and efficiency.
Furthermore, integrating BI trends with cutting-edge technologies like IoT and augmented reality promises to revolutionize how businesses visualize and interact with data. User-friendly interfaces and mobile capabilities ensure accessibility for a diverse range of users, emphasizing the crucial need for businesses to harness the power of BI in today’s competitive market.
As companies increasingly recognize the transformative impact of data-driven decision-making, BI is fast becoming an indispensable tool for driving innovation and achieving long-term success.

