From Facebook to TikTok, Instagram to LinkedIn, social media platforms have become a staple in our daily lives, altering the way we communicate, seek information, and entertain ourselves. 2025 has witnessed a marked shift in how we interact with these platforms, as emerging technologies and an increasingly fragmented user base shape trends.
However, quantifying the average time a person spends on each social media platform is no mean feat. This research article explores the average time spent on social media in 2025, platform by platform.
Research Highlights:
- On average, people spend about 143 minutes (that’s 2 hours and 23 minutes) on social media every day. That’s almost 2.5 hours per day spent scrolling through different platforms.
- Teenagers remain the biggest users, particularly teenage girls, who spend nearly 3 hours a day on social media.
Key Statistics: What is the Average Time Spent on Social Media Each Day?
- In 2024, people spent about 5.3% less time on social media compared to 2023, averaging 143 minutes a day.
- From 2013 to 2024, the daily time on social media increased from 90 minutes to 143 minutes, representing a total rise of 53 minutes.
- The biggest jump in social media use occurred in 2016, with a 15.32% rise, making the daily average 128 minutes.
- In 2020 and 2021, the time people spent on social media remained constant at 145 minutes per day.
- Between 2012 and 2019, there was a steady increase of approximately 4.42 minutes per day annually.
- Social media use peaked in 2023 at 151 minutes per day, while the lowest usage was recorded in 2012 at 90 minutes per day, showing a 67.78% increase during that period.
What’s the Average Time Spent on Social Media in 2025?
The average time spent on social media varies globally, with different age groups and demographics spending different amounts of time. As of 2024, the average person spends approximately 2 hours and 32 minutes daily on social media, according to a social media trends report from GWI.
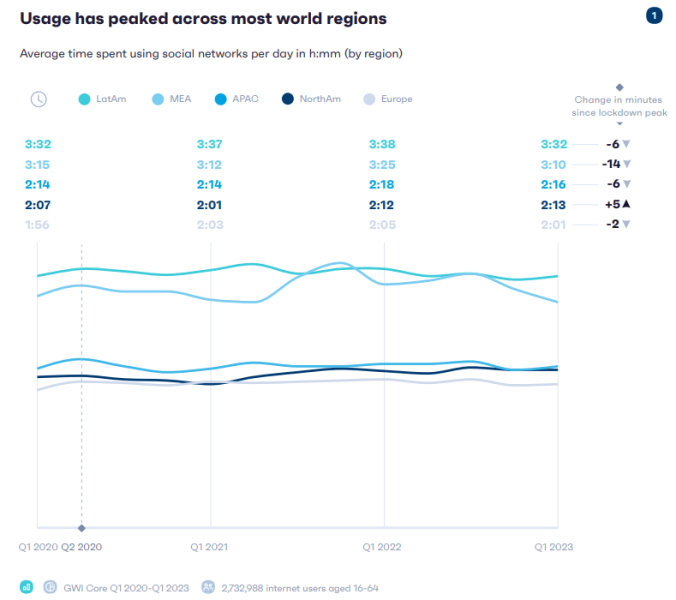
The spike in social media engagement triggered by the pandemic has largely stabilized. However, North America remains an exception, with its social media usage continuing to rise beyond the surge seen during lockdown periods.
Here are a few significant highlights to whet your appetite for the more detailed breakdown to follow:
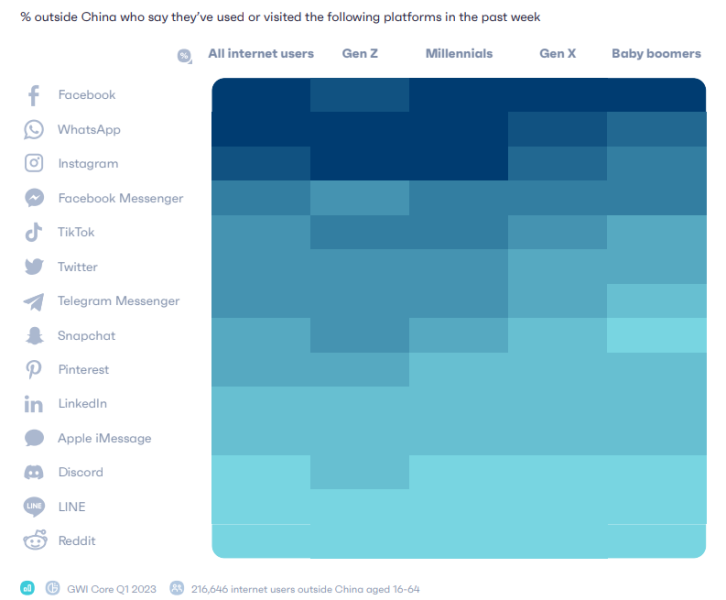
- Despite its well-documented challenges, Facebook remains a major player, with the highest number of internet users reporting that they visited the platform in the past week. Users spend about 3 minutes and 42 seconds per session.
- WhatsApp remains the most popular platform for usage time among internet users, retaining its top spot for another consecutive year.
- Since the first quarter of 2021, there has been a 12% increase in the number of baby boomers who report following influencers.
- Over the past two years, there has been a 41% increase in Western TikTok users who use the platform to stay informed about news, while there’s a 52% rise in those using it to gather information on products and brands. Users are averaging 5 minutes and 56 seconds per session.
- People spend the most time per session on YouTube, with an average of 7 minutes and 25 seconds per session.
- Instagram users spend 2 minutes and 44 seconds, slightly less than Facebook, with around 1 minute less per session.
How Much Time Do People Spend on Social Media?
A Statista report of 2021 indicated that approximately 4.26 billion people worldwide were using social media. It’s predicted that this figure will rise to six billion by the year 2027. In 2024, there are 5.17 billion users.
In terms of how much time each individual spends on social media, factors such as age, gender, race, education, and income level all play a significant role in shaping their engagement with different platforms. Here are some of the key findings.
Social Media Use by Age/Generation
-
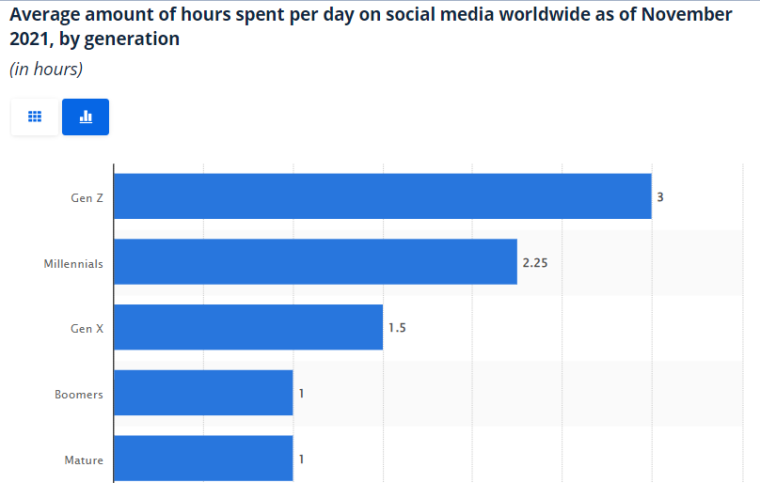
- Generation Z (those born after 1997) spend an average of 3 hours a day on social media per day.
- Millennials (1981-1996) aren’t far behind, with an average of 2 hours and 15 minutes each day.
- Generation X (1965-1980) spend an average of 1 hour and 30 minutes a day on social sites and apps.
- Baby Boomers (1946-1964) spend approximately 1 hour daily on social media.
Social Media Use by Region
-
- Latin America leads in social media usage with an average of 3 hours and 32 minutes per day.
- The Middle East and Africa region follows, with an average usage of 3 hours and 10 minutes per day.
- In the Asia-Pacific region, the average daily social media usage is 2 hours and 16 minutes.
- North America sees an average daily usage of 2 hours and 13 minutes.
- Europe records the least usage, with an average of 2 hours and 1 minute per day.
Social Media Use by Gender
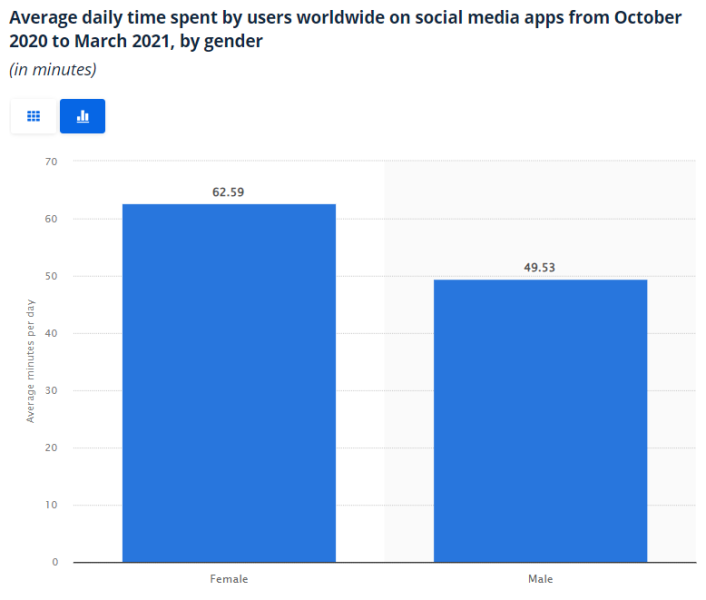
Looking at data covering the six months to March 2021:
-
- Women spend an average of just over 1 hour on social media on their mobile devices daily.
- Men average slightly less, at approximately 49 minutes a day.
Social Media Use by Race
-
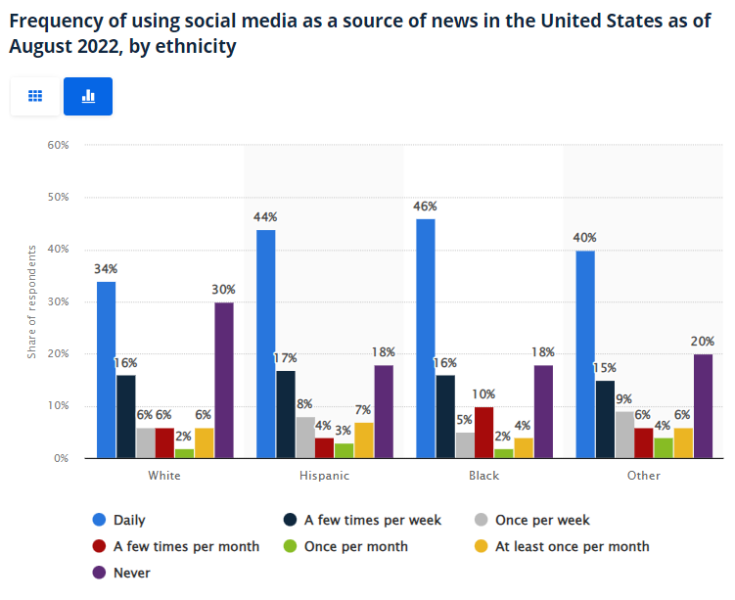
- In the United States, African Americans consume the most social media news than other ethnicities (46%).
- Hispanics are the second-largest ethnic group that consumes news via social media daily the most (44%).
- 34% of white users report getting their news from social media daily.
Social Media Use by Education
-
- 64% of high schoolers in the USA report using at least one social media platform.
- 76% of individuals in the USA who have completed some college-level education report using at least one social media site.
- 77% of American college graduates report using at least one social media site.
 How Gen Z Uses Social Media
Gen Z is 28% more inclined to send voice notes on a daily basis compared to older generations.
At the same time, Gen Zs in the US and UK are less likely to make voice calls than older generations.
On average, Gen Z utilizes more than six social media and messaging apps every month.
The younger generations, such as Gen Z, show a tendency to follow influencers who share their beliefs or values, with 56% affirming this trend.
How Millennials Use Social Media
Like Gen Zs, Millennials, on average, use 6.5 social media apps monthly.
Similar to Gen Z, Millennials are also drawn to influencers who resonate with their beliefs or values, as shown by 56% of them.
How Gen X Uses Social Media
Gen X members are not far behind Gen Zs and Millennials, using an average of 5.8 apps monthly.
Gen X, regardless of their geographical location, spends more time on social media than any other age group, with a daily average of 2 hours and 51 minutes.
How Boomers Use Social Media
Baby Boomers use an average of 4.9 social media and messaging apps each month.
While the primary reason Baby Boomers use social media is to maintain connections with friends and family, since 2021 there has been an increase in their generation for using social media for various purposes such as:
- Watching sports – an increase of 9%
- Finding products to buy – up by 8%
- Following celebrities – a rise of 7%
- Viewing livestreams – growth of 5%
Where Do People Spend Time on Social Media?
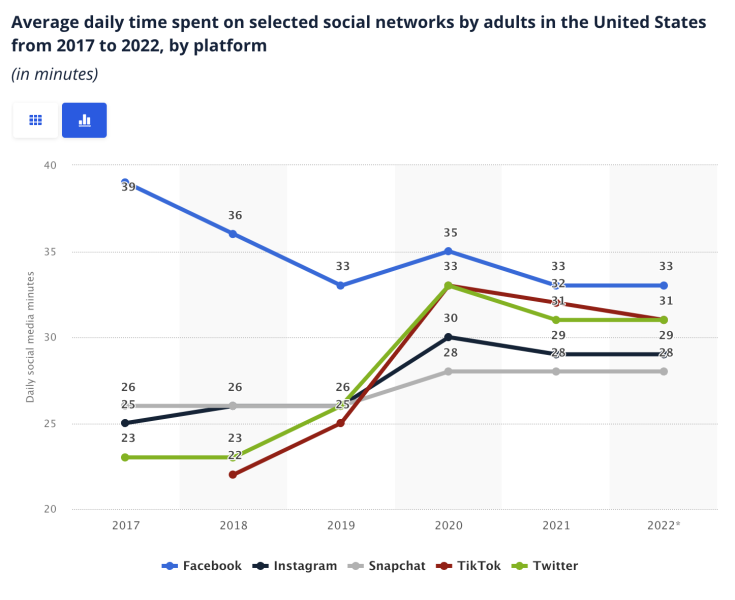
According to data from 2022, the average time American users spend on Facebook is 33 minutes per day.
With nearly 3 billion users in 2024, Facebook remains the most widely used social media platform across the globe.
Facebook Messenger
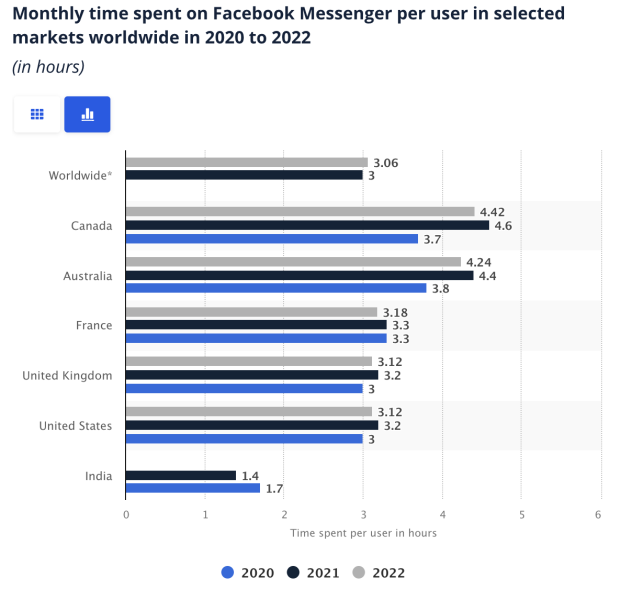
In 2022, the global average time spent on Facebook Messenger per user was around three hours monthly.
In Canada, users dedicated an average of 4.4 hours each month to the app, while in Australia, the average usage reached roughly 4.24 hours monthly. Meanwhile, the monthly usage of Messenger in the United States was around three hours per user for both 2021 and 2022.
With over 2.77 billion monthly active users as of 2024, the platform facilitates daily communication for users around the globe.
Instagram, another product of Meta, sees its users spend an average of 29 minutes per day scrolling through their feeds, posting photos and videos, and interacting with stories.
Users typically spend about 31 minutes per day on Twitter, engaging in discussions, retweeting, or posting their own tweets.
TikTok
As of 2022, users spend an average of 31 minutes per day on TikTok, creating, sharing, and engaging with a variety of content, from dances and comedy skits to educational pieces.
SnapChat
SnapChat users in the United States spend an average of 28 minutes on the messaging app.
Snapchat has experienced quarter-on-quarter growth in daily users, and over the past three years, it’s been observed that Snapchatters are paying more attention to videos. This includes not just user-generated content, but also branded content or advertisements on the platform.
In 2022, the global user engagement on WhatsApp dropped to an average of approximately 17 hours per month, or 33.6 minutes per day, from a higher average of over 18 hours per user per month recorded in 2021.
As of the end of 2020, around 100 billion messages were sent on WhatsApp every day.
YouTube
In 2022, on average, users from around the world dedicated approximately 23.1 hours per month, or 46.2 minutes per day, to the YouTube mobile application.
In particular, South Korean users clocked in an average of around 40 hours per month – 1 hour and 20 minutes daily – consuming video content on the YouTube app. Meanwhile, users in India dedicated approximately 29 hours each month to the app, nearly an hour each day.
BeReal
BeReal encourages users to take two daily pictures: one capturing their activity at that moment, and a selfie with no filters allowed.
According to a September 2022 Zeitgeist study, 42% of respondents expressed an interest in using BeReal, indicating potential for future growth.
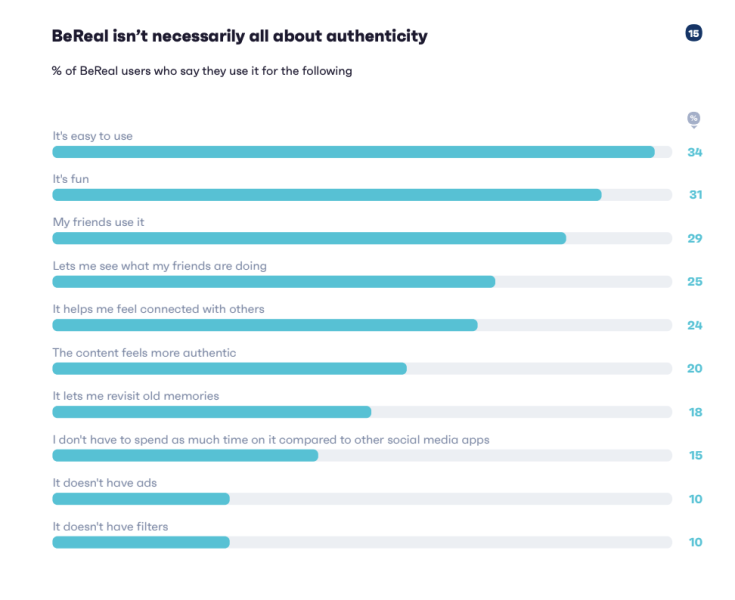
Despite the emphasis on authenticity, the top reasons for user engagement with BeReal include its ease of use, fun factor, and popularity among friends, underlining its straightforward and enjoyable user experience.
Threads
Meta’s new application, Threads, has witnessed an impressive uptake, registering two million users within the first two hours of its launch.
Viewed as a Twitter competitor, Threads allows posts of up to 500 characters, along with photos and videos of up to five minutes, fostering an environment for “friendly” discussions.
To ensure the quality of content, Threads employs fact-checkers and has mechanisms to flag and block posts that are identified as false or misleading, although it has faced a potential lawsuit from Twitter regarding the hiring of its former employees.
Can You Spend Too Much Time on Social Media?
A systematic review published in 2019 found that longer time spent on social media was consistently associated with an increased risk of mental health problems, particularly depression and anxiety.
The systematic review involved a thorough search of various databases, leading to the identification of 13 eligible studies, mostly cross-sectional. The studies were classified into four domains of social media: time spent, activity, investment, and addiction, all of which were found to correlate with depression, anxiety, and psychological distress.
A notable study published in 2020 found that excessive social media use during the COVID-19 pandemic was linked with symptoms of depression and secondary traumatic stress.
It suggested that the vast amounts of shared content related to suffering, illness, and death could have a significant psychological impact on users.
In response to such growing concerns, several social media companies have introduced new tools and features to help users manage their time on these platforms.
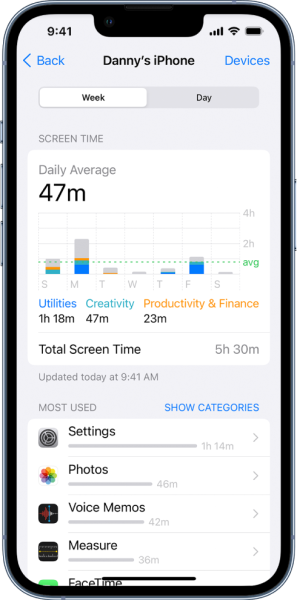
For example, Apple introduced a feature called “Screen Time” as part of iOS 12 in 2018, which provides weekly reports on a device and individual app usage and allows users to set app usage limits.
Additionally Facebook and Instagram have launched “Your Time on Facebook” and “Your Activity” respectively. These features provide users with an overview of the time they spend on the platforms, allowing them to set daily time limits and mute push notifications for certain periods.
Similarly, Google’s Digital Wellbeing, launched in 2019 as part of Android 9 Pie, provides a dashboard to see how much time you spend on your device, including time spent on individual apps, number of times you unlock your phone, and number of notifications received.
Why Do People Spend Time on Social Media?
The top reason people use social media is to stay connected with friends and family, with 49.50% of users citing this as their primary motivation.
Other popular reasons include filling spare time (38.50%) and reading news stories (34.20%).
| Reason | Percentage (%) |
|---|---|
| Keeping in touch with friends and family | 49.50% |
| Filling spare time | 38.50% |
| Reading news stories | 34.20% |
| Finding content (e.g., articles, videos) | 30.20% |
More Gen Zs indicate that they discover products on social media than search engines. This trend is also reflected among millennials.
Social media is increasingly being used as a source of inspiration and organic product discovery, with its usage for this purpose climbing from 9th to 6th place since Q1 2019, even surpassing product research. This trend extends to older generations too, with “finding products to purchase” jumping from 6th place to 4th place among baby boomers from Q1 2021 to Q1 2023.
Trends like #QuietLuxury on TikTok, which garnered over 100 million views, illustrate the focus on minimalist styles and neutral palettes. This shift aligns with a decreased desire among Americans to be the center of attention, likely influenced by economic instability leading to changes in style preference, including beauty, wellness, and homeware.
Initially, social media emerged as a tool for staying connected with friends, exemplified by platforms like MySpace, Facebook, and Bebo.
However, the modern usage of social media, especially among younger generations, has expanded to include seeking advice, researching brands, and discovering engaging content.
The popularity of videos has seen a surge among social media users across various platforms, with the number of platform users who watch videos increasing by 5% since Q1 2021 according to GWI data.
Short-form videos offer benefits to viewers by allowing them to consume more information quickly, encompassing news, reviews, or entertainment. This trend also benefits brands, as social videos are estimated to drive 1200% more shares than text and image content combined, permitting brands to showcase their personality and creativity in their content.
 How Gen Z Uses Social Media