In the dynamic world of business, where decision-makers constantly navigate through a sea of data, the ability to make informed choices is crucial. ANOVA analysis, or analysis of variance, stands out as a statistical model that can be valuable in this context. ANOVA can unlock deeper insights into market trends, customer preferences, and operational efficiencies.
In this guide presented by Business2Community, we will demystify the process of ANOVA for you. Whether you’re evaluating marketing strategies, exploring customer segmentation, or assessing financial performances across different markets, this information will provide a clear illustration of how ANOVA can be applied in real business scenarios.
ANOVA Analysis – Key Takeaways
- ANOVA is a statistical method used to test the differences between two or more means, comparing the variances within and between groups to determine if the means are significantly different.
- This tool is valuable in research and business scenarios, allowing practitioners to make data-driven decisions, identify patterns, and establish correlations among groups.
- Regular application of ANOVA analysis can help uncover key insights and trends from seemingly disparate data, supporting evidence-based planning and strategic decision-making.
What is an ANOVA Analysis?
An ANOVA analysis is a statistical method that enables the comparison of the means of three or more independent groups of data, to determine whether there are any statistically significant differences between them. It achieves this by looking at the variance both within and between these groups.
Delving deeper, ANOVA analysis is based on two estimates of variance. One is based on the variance among the group means and the other is based on the variance within each group. When these variances are compared, if the variance among group means is significantly larger than the variance within the groups, you can conclude that there is a significant difference among the groups.
Who Needs to Do an ANOVA Analysis?
ANOVA analysis has a broad range of applications and is a vital tool for anyone who needs to make decisions based on data.
- New or expanding businesses: If you’re starting your own business or looking to expand into new markets, ANOVA can help you compare multiple potential locations or customer bases and assess which are most promising.
- Departments within a business: Different departments within a company, such as marketing, sales, or HR, can use ANOVA to assess the effectiveness of different strategies or programs. For example, a marketing department might use it to compare the effectiveness of multiple ad campaigns.
- Stock traders: Stock traders can use ANOVA to compare the performances of different investments. By analyzing variance, traders can make informed decisions about which stocks to buy or sell.
- Market researchers: Market researchers can use ANOVA to understand customer preferences and segment markets. By comparing the means of different groups, researchers can identify trends and patterns that provide valuable insights.
How to Perform Your ANOVA Analysis
Performing an ANOVA analysis may seem daunting, especially if you don’t have a deep background in statistics but it’s a systematic process you can follow. Let’s break it down step-by-step.
Step 1: Set up Your Hypotheses
In ANOVA, there are two hypotheses: the null hypothesis (H0) and the alternative hypothesis (H1).
The null hypothesis assumes that there is no significant difference between group means, while the alternative hypothesis assumes that there is a significant difference.

Step 2: Collect Data and Organize
Collect data for each group you wish to compare and organize it in a tabular format. Each row represents an observation and each column a group.

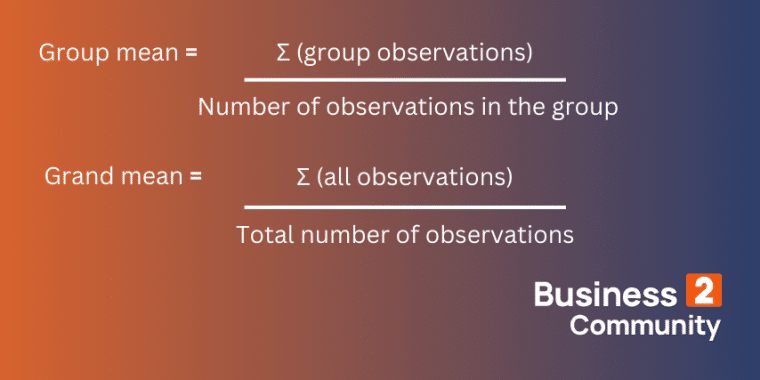
Step 3: Calculate the Group and Grand Means
Calculate the mean of each group and the grand mean (the mean of all observations).
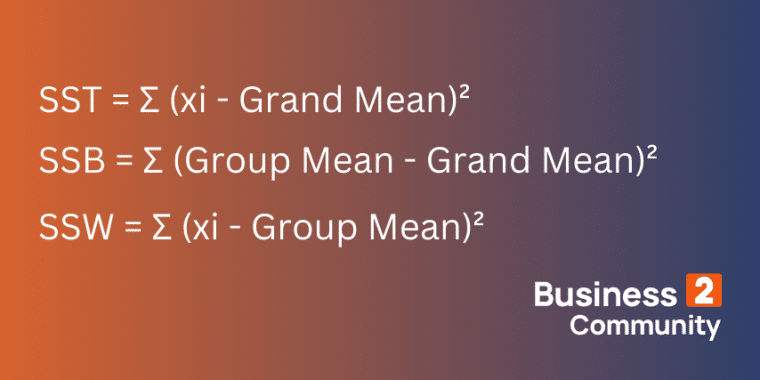
Step 4: Compute the Sum of Squares
There are three sums of squares to compute: the total sum of squares (SST), the sum of squares within groups (SSW), and the sum of squares between groups (SSB).
Step 5: Perform the F-test
Finally, calculate the F-statistic using the formula:
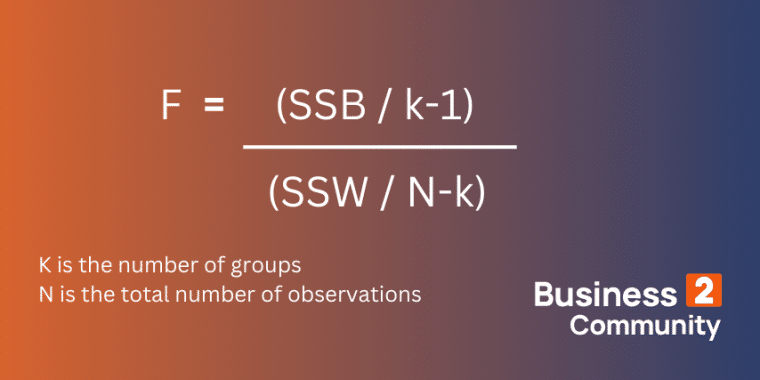
If the F value exceeds a critical value found in an F-distribution table, then you need to reject the H0 (the null hypothesis).
At this point, you can conclude if there’s significant variance among your groups. If the F-statistic is significant, you may wish to perform a post-hoc test to see exactly which group means differ.
Example of ANOVA Analysis
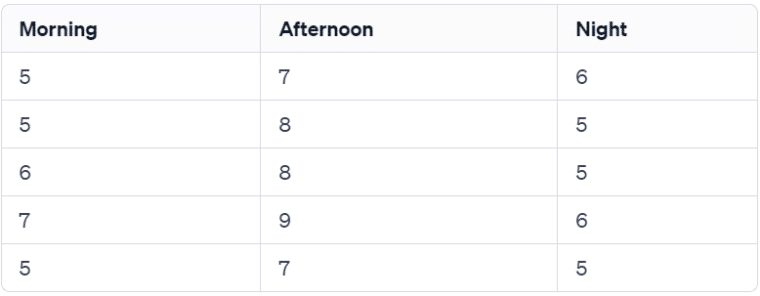
Let’s illustrate the application of ANOVA with a simple example measuring employee productivity based on their work shift. Let’s say the company collects the following productivity data over one week:
- Morning shift: (5, 5, 6, 7, 5)
- Afternoon shift: (7, 8, 8, 9, 7)
- Night shift: (6, 5, 5, 6, 5)
Step 1: Setting up the Hypotheses
H0: μ1 = μ2 = μ3 (There is no significant difference in productivity across shifts)
H1: At least one μ differs (Productivity varies based on the shift)
Step 2: Collecting and Organizing Data
Organize the data in a tabular format, where each row represents the number of tasks completed and each column represents a shift.
Step 3: Calculating the Means
Group mean (morning) = (5 + 5 + 6 + 7 + 5) / 5 = 5.6 tasks
Group mean (afternoon) = (7 + 8 + 8 + 9 + 7) / 5 = 7.8 tasks
Group mean (night) = (6 + 5 + 5 + 6 + 5) / 5 = 5.4 tasks
Grand Mean = (5.6 + 7.8 + 5.4) / 3 = 6.27 tasks
Step 4: Computing the Sum of Squares
Note: Σ is a symbol (called Sigma) used in mathematics that means “sum up.” It is just telling you to add up everything following it in the equation.
SST = Σ (5.6 – 6.27)² + (7.8 – 6.27)² + (5.4 – 6.27)² = 1.34
SSW = Σ (xi – group mean)² = Σ (5 – 5.6)² + (7 – 7.8)² + (6 – 5.4)² = 1.8
SSB = Σ (group mean – grand Mmean)² = Σ (5.6 – 6.27)² + (7.8 – 6.27)² + (5.4 – 6.27)² = 2.64
Step 5: Performing the F-test
F = (SSB / k-1) / (SSW / N-k) = (2.64 / 2) / (1.8 / 12) = 8.8
With 2 and 12 degrees of freedom, consulting the F-distribution table, you find the critical value is around 3.89. As 8.8 exceeds 3.89, we reject the null hypothesis – H0 – and you can conclude there is a significant difference in productivity across shifts. Further post-hoc testing could be done to identify which shifts differ in productivity.
When to Use ANOVA Analysis
Knowing when to apply ANOVA is crucial in order to glean meaningful insights from your data. Here are three circumstances when using the ANOVA test is particularly beneficial:
Evaluating Employee Training’s Impact on Customer Satisfaction
ANOVA tests can be instrumental in corporate environments to measure the impact of employee training on customer satisfaction.
For instance, if a company has implemented different training programs across various branches, an ANOVA test can compare the average customer satisfaction scores across these branches. This can help identify which training program is most effective in enhancing customer satisfaction.
Comparing Product Performance Across Different Markets
When a company operates in diverse markets, it might observe varying performance of a product across these markets. An ANOVA test can help determine if these variations in performance are statistically significant or merely due to chance.
Assessing the Effectiveness of Different Medical Treatments
In healthcare research, ANOVA is used to compare the effectiveness of different treatments. For example, if a new drug is tested along with a placebo and a standard treatment, ANOVA can help determine if the new drug performs significantly better or worse than the existing treatments.
How to Adjust Your ANOVA Analysis
In real-world scenarios, business owners or traders often need to adjust their ANOVA test based on changing circumstances or business objectives. Here are a few examples of how a particular independent or dependent variable in your data analysis can be controlled or altered:
- Changing pricing: If you operate a business and want to understand how pricing affects sales, you can conduct an ANOVA analysis by creating different groups based on pricing strategy (e.g., low, medium, and high pricing tiers). If significant differences emerge, it may suggest that pricing plays a crucial role in sales, and adjustments can be made accordingly.
- Modifying product features: Businesses can group their products based on different features and use ANOVA to analyze their effect on sales. If a particular feature results in higher sales, it may be beneficial to incorporate it into more products.
- Changing overheads: Businesses with varying overhead costs across departments or locations can use ANOVA to understand the impact on profitability. By grouping locations or departments based on costs, you can determine if a variance in overhead affects overall profit.
- Evaluating marketing techniques: If a company uses different marketing strategies (e.g., social media marketing, email marketing, content marketing), an ANOVA test can be conducted to compare their effectiveness. The results can guide future marketing efforts.
- Analyzing employee performance: A business can group employees based on different factors such as experience, education level, or role, and perform an ANOVA test to understand if these factors significantly affect performance.
These examples show how altering the variables in your ANOVA analysis can provide insightful data, helping you make informed decisions and optimize business operations.
Limitations of ANOVA Analysis
While ANOVA is one of the statistical tools that can help you understand the significance of multiple group differences, it’s important to be aware of its limitations.
One major limitation is that ANOVA only analyzes the means of different groups and assumes the variances are equal across all groups, which might not always be the case. This is known as the assumption of homogeneity of variances. If this assumption is violated, the results of the ANOVA might be inaccurate.
Another limitation of ANOVA is that it doesn’t show which specific groups were statistically significantly different from each other. It only tells you that at least two groups were different. If you find a significant effect using ANOVA, a post-hoc comparison is necessary to find out which groups are different.
ANOVA is sensitive to outliers, which can influence the group means and variances leading to misleading results. It assumes the data is normally distributed within each group and between groups, but real-world data can often deviate from a normal distribution, especially with smaller sample sizes.
Lastly, ANOVA does not account for dependent variables. It assumes all observations are independent of each other. In cases where this assumption is violated, other statistical methods may be more appropriate. To enhance your analysis, consider checking your data against the assumptions of ANOVA and consider using a complementary statistical test.
For example, Levene’s test can be used to check the assumption of homogeneity of variances, while a Tukey’s HSD test or a Scheffé’s test can be conducted post-ANOVA to determine which particular groups have significant differences. While dealing with dependent data sets, repeated measures ANOVA or mixed ANOVA can be appropriate alternatives.
The Value of ANOVA Analysis
ANOVA is a tool for exploring the significance of differences between group means, offering a statistical foundation for decision-making in various contexts. Whether you’re evaluating different marketing strategies or seeking to understand the impact of potential hires on team performance, ANOVA provides the insight necessary to make informed, data-driven decisions.
The versatility of ANOVA is another key attribute, allowing for adjustments based on changing business circumstances or objectives. By modifying independent variables, such as pricing tiers, product features, overheads, or employee grouping factors, your business can gain deeper insights into factors affecting sales, profitability, and performance. However, the utility of ANOVA extends far beyond these examples, offering a framework for analyzing any situation where a comparison of group means is required.
Despite its limitations, such as the need for complementary post-hoc tests to identify which specific groups differ significantly, ANOVA remains a cornerstone of statistical analysis in the business world. By understanding these limitations and complementing ANOVA with other methods, you can enhance the accuracy and reliability of your findings.
Ultimately, the regular application of an ANOVA test in your business strategy can significantly contribute to efficiency, growth, and overall success, ensuring that your decisions are not just grounded in intuition, but backed by statistical evidence.
