ABC analysis, commonly known as ABC inventory analysis, is one of the most popular inventory management methods used by firms to divide items into three categories according to their importance. Conducting an ABC analysis in your next strategic planning session can save costs, improve pricing strategies, and accurately measure the total inventory value.
To give you a head start in inventory management, our experts at Business2Communtiy have meticulously curated this guide to using the ABC inventory analysis. From its real-life applications to limitations, we will cover everything you need to know.
ABC Analysis – Key Takeaways
- An ABC analysis helps your business construct an effective inventory management system by prioritizing items with the highest value using the Pareto principle.
- ABC inventory analysis breaks down your total inventory into categories A, B, and C.
- Due to its limitations, the ABC analysis should be used together with other analytical tools like the PESTEL analysis and inferential statistics.
What is an ABC Analysis?
An ABC analysis is an inventory management tool used to identify the values of your inventory items and rank them by their importance/contribution. It is a quantitative analytical technique for strategic planning.
Businesses widely adopt this technique in their cycle counting process to optimize stock levels. Using ABC analysis in inventory management can save storage space and production costs by centralizing resources on in-demand products.
The Pareto Principle in the ABC Analysis
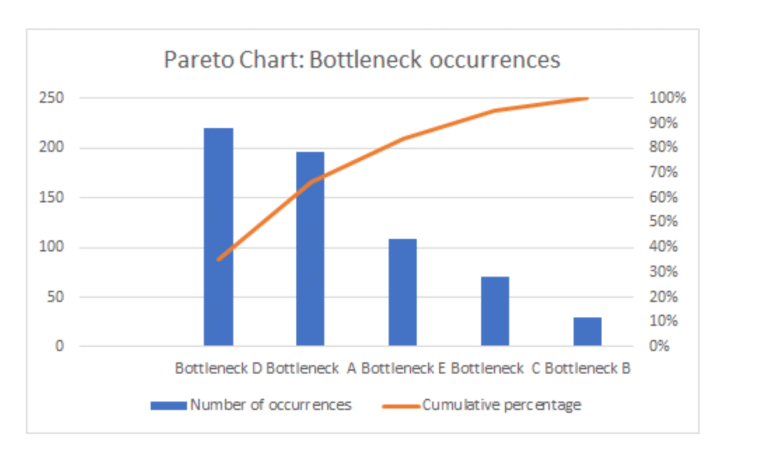
The ABC analysis is based on the Pareto principle, which assumes that 80% of the outcomes come from 20% of the efforts. Conclusions drawn from the Pareto principle look like this:
- 80% of purchases come from 20% of your clients
- 80% of the production costs are related to 20% of your products

By locating the 20% of causes, your company can allocate resources to these key aspects to enhance performance. The ABC analysis adopts the Pareto principle and uses it in stock classification in the business world.
Read more details about how to undertake a Pareto analysis here.
Components of an ABC Analysis
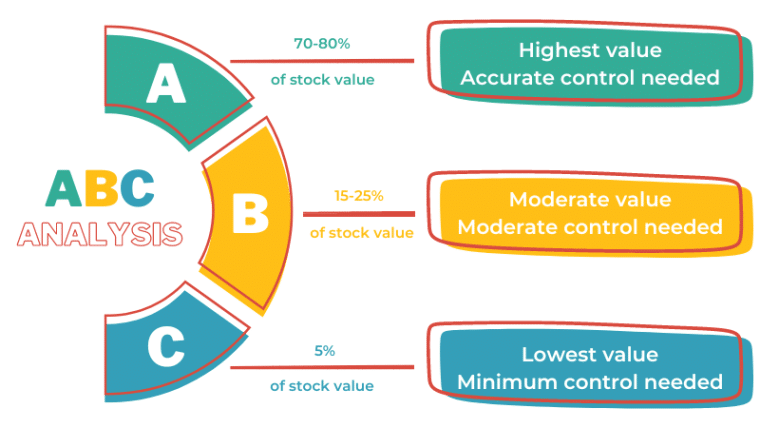
This method classifies stocks into three categories based on their profitability or importance:
- Category A items: Best-performing/most important products
- Category B items: Fairly important products
- Category C items: Worst-performing/least important products

Class A items are the ones that lead to 80% of the outcomes. They contribute the most to your stock value and require the most accurate control to budget costs.
In inventory management, these products are the ones that can maximize your efforts. The ABC analysis assumes that a business has fewer A items and more B and C items to meet the 80/20 rule.
Class C items are worth the least and may even be obsolete inventory. Their return on investment is likely below standard. You can consider replacing or lowering the output levels to make room for more profitable items.
The ABC classification is integral to supply chain management, providing key insights into customer demand and optimal stock levels.
Who Needs to Do an ABC Analysis?
Since ABC analysis concerns the physical production line of a company, utilizing this method is essential if you are running a factory, expanding production, or introducing a physical line.
Learning about efficient inventory control techniques allows your business to focus on popular products with the greatest demand. ABC analysis enables you to target the highest-value stocks to increase the sales volume.
It also allows for better inventory control and reduces storage costs by reducing production on slow-selling items.
How to Complete Your ABC Analysis
To do an ABC analysis, you first need to decide which aspect to work on. You can conduct the analysis based on your total sales revenues, consumers’ purchasing power, or annual consumption value, also known as the usage value.
Regardless of the unit you want to use, the procedures remain the same. Let’s take a look at an example created by the management software platform Eazy Stock.
In this ABC analysis example, we are trying to divide the ABC categories based on the annual consumption value.
The formula is:

Using this formula, you can gather and calculate the inventory data and arrange them in descending order.
At the bottom of the “annual number of units sold” column and the “annual consumption value” column, write down the cumulative total.
After that, calculate the percentage of the annual number of units sold and the annual consumption value for each item.
The results reveal that tape measures and carabiners are 20% of the inventory items that contribute to 80% of the annual consumption value. They are category A products with the highest potential to bring in more sales for the company.
Eyebolts, ferrules, and machine screws are category B items. You can choose to maintain the production level or reduce the safety stock to avoid hoarding storage space and make room for category A items.
The rest are category C items. They are the least important in your production. You can consider lowering the output levels for better warehouse management and to lower overhead costs like warehouse rent and production utility costs.
The saved costs can go towards increasing the production level of Category A items, which leads to more profits.
It is worthwhile to note that the 80/20 rule is a general rule of thumb only. In real-life applications, the top 20% of products may contribute to 75%, 95%, or 90% of the outcomes.
For example, if you sell a total of 5 different products, one product (20%) alone could contribute to 90% of your sales. Depending on your business needs, you can determine the break-off point logically even if it deviates from the 20% mark.
Examples of ABC Analysis
Utilizing the ABC analysis can significantly improve business performance in a wide range of aspects. Here are a few examples to demonstrate its business applications in real life.
Example 1: Use the ABC Inventory Analysis For Better Inventory Management
You are working with your inventory managers to construct a better business model to increase cash flow. To achieve this goal, you can use ABC analysis to analyze inventory value, based on your inventory turnover rate. The results will inform you about fast-selling products that you can continue to produce to turn them into cash quickly.
Regular cycle counting produces a detailed record of your inventory. It’s a good practice for your inventory planners to gather information about the usage value so they can better evaluate suitable safety stock levels and decide on which products to promote.

Example 2: Segment Your Audience With an ABC Analysis
Other than inventory management, the ABC analysis is also a great technique to segment your clients. By investing in the right target pool, you can get an advantage in understanding customer demand, increasing customer satisfaction rates, and improving the profit margin.
Metrics like support costs and total spending are useful for assessing the willingness to purchase or the purchasing power of your audience base. Once you have found the category A group, you can work on enhancing the user experience for this group and save money on other groups while still increase total sales.
Example 3: Use the ABC Analysis to Identify Profitable Items
An ABC analysis reveals the most profitable products/services in your operations. Centralizing resources on category A items and cutting production on B items and C items are more likely to bring up the net profit. Your supply chain should ensure enough resources for higher-performing products.
How to Adjust an ABC Analysis
Inventory managers have to adjust the ABC analysis results quite frequently in the real world. A company may update its ABC analysis metrics or take down some inventory items after a collaboration ends.
The ABC analysis in inventory management is a simple method to set the blueprint for your production. Therefore, updating the numbers and results is fairly straightforward.
To adjust an ABC analysis, you need to count inventory of all products again to make sure the total inventory value is up to date.
Then, adjust the usage value or other metrics you are using and rearrange the order if necessary so it’s always in descending order. Divide the products into the new ABC inventory categories.
A lot of firms implement regular cycle counting and ABC analysis updates to make sure the results still align with their current business strategies.
Amending your ABC analysis pushes you to look at the latest stock levels, which are essential in the decision-making process. To give the most accurate results and implement quality inventory control, you should always refresh the ABC analysis when something changes in the metrics.
Limitations of ABC Analysis
The ABC inventory management tool is undoubtedly a useful first step in understanding your production and costs. However, due to it being a simple process, this technique fails to consider several key aspects.
To fully utilize this method, you should combine it with other analytical tools.
It Does Not Consider Non-Monetary Benefits
Although the inventory cost and the profit margin are crucial indicators for an operation, there are non-tangible benefits the ABC analysis method fails to address.
For example, a brand may still want to keep promoting a poorly performing but inclusive product line classified as category C because it improves the company image. Raising awareness about inclusiveness can lead to collaborations with other firms and appeal to a wider customer base.
Since an ABC analysis strictly cares about the quantifiable values of each item, it neglects these long-term, non-monetary benefits. You have to think carefully about what each product means to the company, both in terms of sales volume and building company goodwill.
It Does Not Consider Seasonal Changes in Demand
The ABC method only targets data points from a specific period. It doesn’t take into account seasonal changes or fluctuations in demand due to emerging trends. If you only calculate data from the winter period, thermal socks are likely to be a class A item, but, the sales are certainly going to plummet in summer.
Even if you consider the whole calendar year, a particular product may be generating the most revenue because of a social media trend. The effects are likely to wear off in the next calendar year.
To consider these changes, you can implement ABC analysis with other qualitative analytical tools like a PESTEL analysis to examine the external factors influencing production to make up for the neglected business elements.
It Doesn’t Give Predictions
Forecasting demand and making predictions are vital in the strategic planning process. It highlights possible growth so you can allocate resources accordingly. An ABC analysis itself doesn’t estimate future demand or how those 20% of selected products will perform long-term.
You can include other quantitative research tools like inferential statistics to make projections based on historical data. It provides a more in-depth analysis of your company’s potential, helping you curate profitable business plans with a higher chance of matching reality.
The Value of ABC Analysis
An ABC analysis helps you curate the best inventory management system so you can allocate resources efficiently in the supply chain and minimize the annual cost. Classifying your assets into three categories allows you to prioritize important factors.
Despite having its limitations, ABC analysis is a powerful starting tool that builds the foundation for further analytical work. To get the most comprehensive results, you can combine this technique with other analytical tools. Whether you are a new business owner or a project manager, using ABC analysis in your analytical work can greatly enhance the company’s performance.


