One of the best things about digital marketing (over traditional offline marketing) is that you can measure nearly every part of your strategy. Free tools like Google Analytics provide comprehensive information on how your website’s performing, so you’re never uninformed about whether your SEO efforts are bringing in the right results.
But the data points are so extensive that for many businesses, the problem isn’t a lack of data but rather figuring out which SEO metrics to focus on.
In this post, I’m going to walk you through
- Nine of the most important SEO metrics and what they mean.
- Two metrics to ignore (or look at from a different angle).
- Where to find them in Google Analytics and how to improve them
When you track the right metrics, you can get an accurate picture of your performance, continuously improve your strategy, and ultimately increase rankings and ROI.
9 important SEO metrics to track
When evaluating your SEO strategy’s success, there are near-endless metrics you can monitor. To help you focus on the right metrics — regardless of what your business is about — here are the top nine SEO metrics and how to track them.
1. Organic traffic
Let’s start with the obvious one. Organic traffic is the traffic you get from the search engine results pages (SERPs) without paying for ad placement.
Your overall traffic can be from multiple sources (search engines, social networks, direct searches, other sites), and narrowing your focus to organic traffic shows your website’s visibility in search for keywords related to your business and niche. So if your SEO strategy is working, the number of visitors you earn from search results should steadily go up.
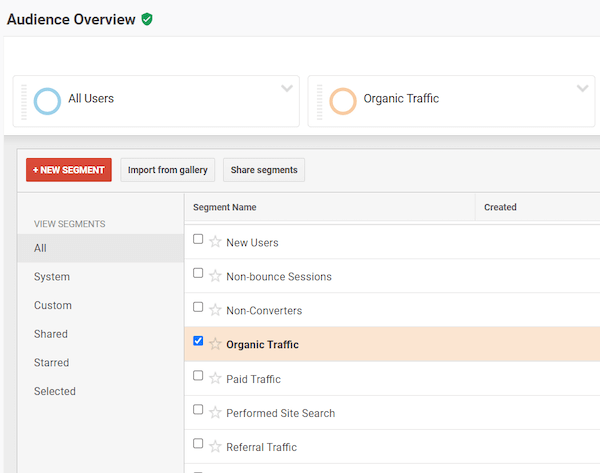
To track organic traffic in Google Analytics, log in to your dashboard and select “Add Segment” in the default Audience Overview.
Select “Organic Traffic” and hit “Apply”.
You can now view organic traffic as a percentage of the total traffic.
2. Click-through rate (CTR)
Your organic click-through rate shows the percentage of people who visit your website after stumbling upon your web pages in the SERPs. So if 1,000 searchers see your page listing in the search results and 100 people click through to your website, your CTR for that page is 10%.
Organic CTR shows how well your listing (with the title, meta description, and URL) appeals to your audience and how well it manages to catch their attention.
If your CTR is low, it may mean your title or meta description is not engaging, or the content isn’t relevant to what the user is looking for. Here are some ways to improve your organic CTR.
You can monitor CTR directly in Google Search Console under the “Performance” tab.
View CTR by page, query, or device. In particular, monitoring CTR by page provides valuable insights as to which content isn’t bringing in sufficient click-throughs via SERPs.
Learn about more ways to use Google Search Console to improve your SEO.
3. Exit rate
As the name suggests, exit pages are the last pages your visitors view before leaving your website.
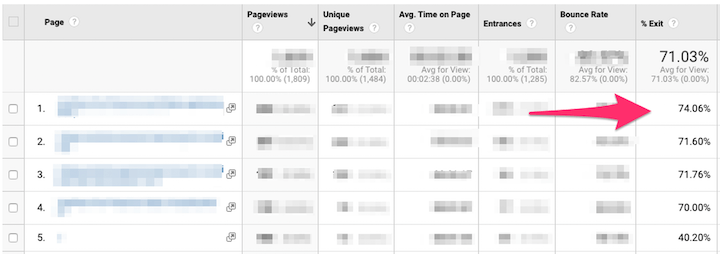
Your top exit pages are the ones that make people lose interest in your website and go elsewhere. These are areas of your website where most visitors drop off, so it’s important to track your top exit pages.
So if you see that a large chunk of your traffic leaves after they visit a specific page, it may suggest that the page or its content needs work.
To track exit percentage for individual pages, head over to “Behavior” > “Site Content” > “All Pages”.
To reduce the exit rate on your pages, you can:
- Ensure your page layout and content structure is easy to understand.
- Include clear internal links and calls to action to guide visitors to other relevant content and pages.
- Add quality content, including visuals (image and video) to better engage visitors.
4. Pages per session
An important on-site user engagement metric, pages per session denotes the number of pages your users visit on average before bidding adieu to your site. The higher this metric the better, as it means people are visiting multiple pages and sticking around longer.
In Google Analytics, go to “Acquisition” > “All Traffic” > “Channels” to see pages per session for each traffic channel.
If this metric is low, it may indicate your content isn’t engaging or relevant enough for visitors to check out other pages. Or, it means that your site navigation is not user-friendly. The tips mentioned above for top exit pages are applicable here as well.
5. Average page load time
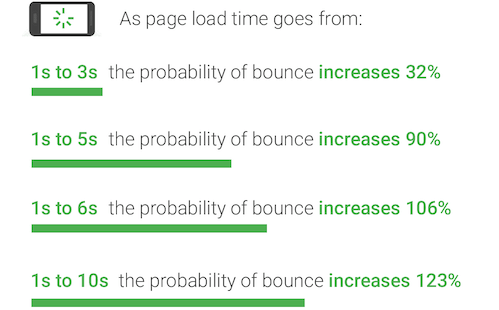
Your site speed is a pivotal SEO ranking factor (for both desktop and mobile) and can make or break your rankings (and user experience).
The average page load time is the time taken to display the full content on a page. You can find this metric under “Behavior” > “Site Speed”. You can then see your average load time for all pages, or check the times for individual pages.
6. Core Web Vitals
Google is increasingly shifting its focus on rewarding websites that provide a delightful user experience (UX) with higher rankings, and how well (and fast) your pages load is at the heart of UX.
Conventional performance metrics like load time and DOMContentLoaded focus on details that are easy to measure but don’t necessarily translate well to what the users care about. So if you focus solely on optimizing your average page load time, you can end up with a website that still renders poor UX.
And so, Google took the above speed metric a step further in 2020 by introducing Core Web Vitals. These are user-centric performance metrics and serve as a more granular, UX-centered way of measuring page load time.
Here’s a brief description of the three Core Web Vitals as per the official Chromium blog:
- First Input Delay (FID) measures responsiveness and quantifies the experience users feel when trying to first interact with the page.
- Cumulative Layout Shift (CLS) measures visual stability and quantifies the amount of unexpected layout shift of visible page content.
- Largest Contentful Paint (LCP) measures perceived load speed and marks the point in the page load timeline when the page’s main content has likely loaded.
The “Enhancements” section of Google Search Console shows you how the pages on your site perform based on the Core Web Vitals, and you can also use Google’s PageSpeed Insights tool to access these metrics and get recommendations to improve your site’s performance.
Head here for five ways to improve your Core Web Vitals.
7. Backlinks and referring domains
Backlinks are one of the most critical ranking signals on Google. Plus, a recent study of over 11 million Google search results suggests there’s a strong correlation between rankings and the number of referring domains.
The number of backlinks includes all the links from external sources pointing to your site, whereas referring domains represent the number of unique domains from which you have incoming links.
The quality of backlinks matters more than the quantity. Ten links from high-quality and authoritative domains are more valuable than 100 backlinks from average or low-quality domains. Also, though every link you build can help your SEO, links from new referring domains are typically more potent than links from domains that already linked to you.
Ahrefs is a great SEO tool to keep track of your backlinks and referring domains. You can see the list of websites linking to you, which pages they’re linking to, and the domain rating of these referring domains.
8. Top keywords ranked
As you work on optimizing your website to rank for your target keywords, it’s a good idea to monitor how your rankings for those keywords change.
By knowing which keywords you’re ranking for, you get a sense of your current organic search visibility share and can decide whether to focus on further optimizing for those keywords or targeting other keywords you want to rank for but aren’t yet.
You can track your keywords ranked using a position tracking tool like SEMrush. The Organic Search Positions report shown below helps you monitor ranking changes over time and see how your overall search visibility is improving.
9. Pages crawled per day
A fast crawl rate means the Google crawlers can index your site easily and quickly, improving your odds of earning a higher ranking on the SERPs.
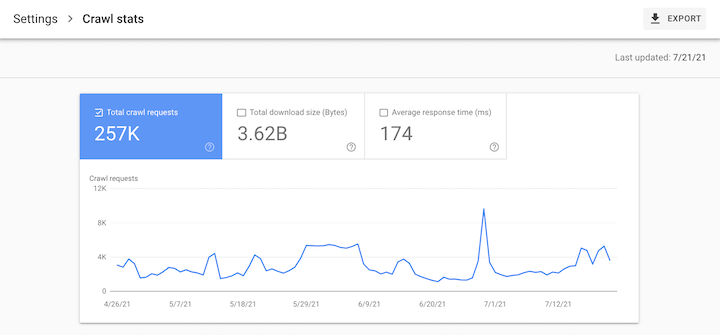
In Google Search Console, you can see how many pages Googlebot crawls every day (for the last 90 days) by going to Settings > Crawl stats.
If you have hundreds of pages and only a percentage of them are getting crawled, it could hint at an issue with your crawl budget. Googlebot won’t crawl your whole website if it has to consume too many of your system resources in doing so.
While an increased crawl rate will not necessarily lead to better rankings, it’s a technical SEO metric worth tracking and optimizing.
2 SEO metrics to ignore
With so much data available in modern analytics tools, it’s tempting to consider everything as a KPIs to get a fuller picture. But misused data can be deceptive. Here are a couple of metrics you should either ignore or look at differently.
1. Conversions
This one’s certainly debatable, but simply looking at the number of conversions on your website in a specific timeframe as a measure of your site’s performance could be a mistake. That’s because conversions don’t convey the full story.
For instance, if 10 visitors purchased something on your website yesterday, but only four did today, is your website doing poorly today? Not necessarily. If the products sold today are more expensive than the ones you sold yesterday, or if the total order value is higher than yesterday’s, the number of conversions gives an inaccurate impression of how well your site is doing.
Furthermore, a conversion can mean different things for different websites, from filling out a newsletter form to registering for a webinar. And not all of these translate to income for your business. So you can have an impressive conversion count but not generate any revenue from them.
Simply put, conversions in SEO can mean many things besides a purchase. And if it doesn’t ultimately lead to revenue, it shouldn’t be a top metric to track.
2. Bounce rate
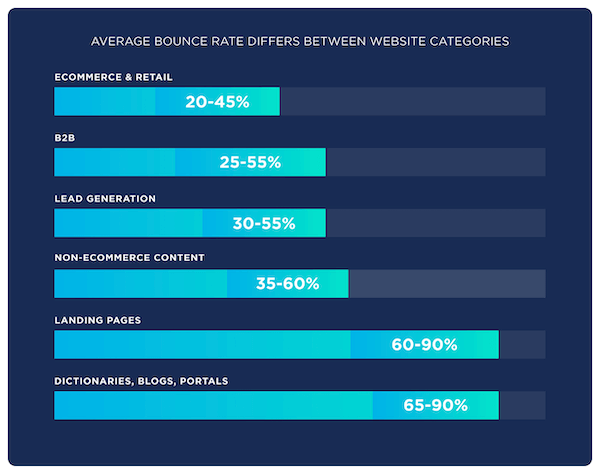
Bounce rate is the percentage of visitors who leave your site after visiting just one page. It means the visitor did not click any internal links to view any other pages on your website.
Considering site-wide average bounce rate as an SEO metric isn’t a good idea. That’s because a high bounce rate can have different meanings and doesn’t necessarily give a concrete insight.
While it could indicate irrelevant content or poor design or navigation, it could also mean that your content instantly and completely satisfies your user’s query.
For example, If a visitor organically lands on your blog post, reads the post from top to bottom, and leaves satisfied with actionable takeaways, it still classifies as a “bounce”. In reality, your post was read completely and was found useful by the visitor.
To look at this metric on a page level is fine, but using site-wide average bounce rate as an important metric can be misleading.
In short, if bounce rates are so variable, you simply can’t tell whether the average bounce rate figure going up or down is a good or bad thing.
Start tracking your SEO metrics now
If you’re not yet tracking the top nine metrics outlined above, it’s time to get started. Fortunately, with a few free and affordable tools like Google Analytics, Search Console, and Ahrefs (or SEMrush), you can easily track all these SEO metrics and start making continual improvements.
So, ready your SEO toolkit and start tracking!
- Organic traffic
- Click-through rate
- Exit rate
- Pages per session
- Average page load time
- Core Web Vitals
- Backlinks and referring domains
- Keyword rankings
- Pages crawled per day
Read more: George Konidis


