According to eMarketer, U.S. adults spent around 12 hours and seven minutes a day consuming media across all channels and devices in 2017, of which nearly three hours were spent in mobile apps. With the rise of audio books, streaming services, and online news sites, it’s no surprise that mobile users consistently turn to their devices for media and entertainment content.
To see just how much consumers dig their media and entertainment apps, we examined our latest Media and Entertainment Benchmarks for the second half of 2017.
Time in app is trending upwards
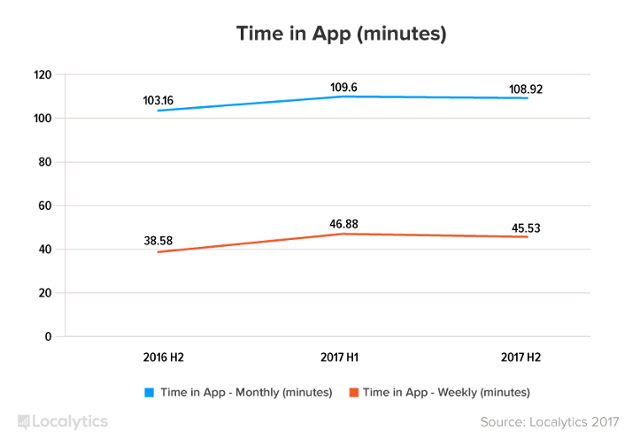
An increase in media and entertainment app launches brings the average monthly time in app to one hour, 49 minutes, an increase of 6% since the second half of 2016. Average weekly time in app has also increased by 18%.

Time spent in these apps is normally higher than in other app categories because the content demands prolonged attention. Streaming a sports game, listening to music, or reading the news are time-intensive activities, whereas activities in apps under a category such as retail are completed more quickly (i.e. buying an item off Amazon or eBay).
There has been a 25% increase in weekly app launches since the second half of 2016, which explains the significant jump in time in app. Great onboarding strategies, improved personalization (meeting users’ needs and expectations), and high quality push campaigns are likely reasons.
Improved engagement means higher retention
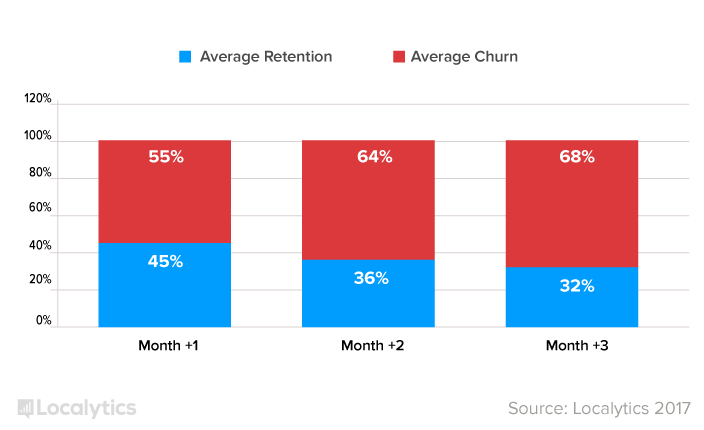
Similar to our other benchmarks, user retention in this category saw an upward trend in the second half of 2017. The percentage of users who continued using the app one, two, and three months after their first session has increased by 25%, 33%, and 52% respectively since the second half of 2016.
When it comes to entertainment and media, mobile users are looking for apps that they can rely on long-term. An app is the perfect companion to a newspaper subscription, which may explain why retention is trending upwards. Electronic media remains an essential aspect of consumers’ lives and loyalty to favorite news sources is on the rise.
Push engagement soaring, iOS opt-in rates showing a decline, and in-app conversions are on the rise
iOS push engagement (defined as the average number of sessions recipients of the message had within the first week of receiving the message) has increased by a whopping 77% since 2016, whereas Android push engagement has increased by an impressive 14%.
2016 H2 2017 H1 2017 H2 % change (YoY)
| iOS Push Engagement | 2.17 | 2.88 | 2.47 | +14% |
| Android Push Engagement | 2.31 | 3.35 | 4.09 | +77% |
Android’s push opt-in rate remains at a fairly steady level, but the same cannot be said about iOS. Because of strict guidelines and iOS users’ preferences when it comes to push notifications, iOS opt-in rate is decreasing. There is a good chance that Apple users are choosing apps that allow for a more personalized experience.
Finally, both iOS and Android in-app conversion rates are seeing an increase of 35% and 41% respectively since H2 2016. It is likely that marketers are implementing more effective messaging strategies (targeting and content) to achieve higher conversion. Many apps are also taking advantage of mobile wallets, a feature that appeals to anyone using Apple or Google Pay to make mobile purchases.
Media and entertainment apps are dominating the mobile space – push engagement, retention, and time in-app each saw significant increases. As mobile entertainment demand rises, it is simply logical that engagement will continue to rise with it.
Check out the full report to learn more.

