Have you ever felt like this?

Image Source: Gifimage
Or like this?

Image Source: gif-finder
Imagine this is your user when your app stops responding. Not a pretty picture for your retention eh?
ANR (App Not Responding) is a state in which the app is frozen and does not respond to any user gestures or draw. Unlike unresponsive gestures which are attributed to a design decision (e.g. an image that mistakenly looks like a tappable button), ANRs usually occur due to long running code that freezes the “UI thread”.
ANRs are a fact of life for mobile apps, but that doesn’t mean you have to take them as common occurrence and that’s that. With the combination of quantitative and qualitative analytics, you can go beyond basic OS vitals data, dive deeper into your ANR occurrences, understand their affect on your app’s UX, and resolve them quickly and accurately.
Say goodbye to those “WTF” moments by following this two-step analysis method:
1. Aggregate Screen-Level Analysis

With quantitative analytics that tracks ANR issues, you can pinpoint problematic screens and occurrence patterns with the utmost efficiency. ANR issue aggregation helps you look at the big picture when it comes to the overall impact on your app and prioritize your workflow accordingly. For example, with Appsee‘s ANR analytics, you can assess the total number of affected screens, sessions, users and the average duration of each ANR state. Plus, you can compare these key metrics across device, app version, and select date buckets.
When assessing and diagnosing your ANR states on the aggregate level, Android’s top development site recommends keeping an eye out for the following patterns:
- The app is doing slow operations involving I/O on the main thread.
- The app is doing a long calculation on the main thread.
- The main thread is doing a synchronous binder call to another process, and that other process is taking a long time to return.
- The main thread is blocked waiting for a synchronized block for a long operation that is happening on another thread.
- The main thread is in a deadlock with another thread, either in your process or via a binder call. The main thread is not just waiting for a long operation to finish, but is in a deadlock situation.
A gentle warning: don’t stretch yourself too thin by trying to dissect every single ANR issue. To streamline your data-driven workflow, some ANR analytics tools, like Appsee’s, will also provide you with the ability to “hide insignificant ANRs”. What does this mean? As devices may randomly be non-responsive due to operating system issues, rather than app-specific issues, selecting this option will only show screens in which the % of affected sessions (relative to total number of sessions that visited that screen) is more than 1%. This can help you organize your ANR issue reports and focus on only the data you need.
So now you’ve got a solid sense of how many ANR issues are occurring in your app overall. But how can you and your fellow dev team easily recreate those individual issues and resolve them? The answer brings us to our next section.
2. Single-User Session Recordings

While ANR analytics are an aggregate, quantitative approach to your ANR issues, user session recordings represent a qualitative, single-user view.
Just as it can be challenging and time consuming to attempt to resolve in-app crashes with only crash logs and quantitative data, the same goes for ANR issues. Total ANRs and affected users, are powerful stats on your app’s health, but that’s exactly it, they are mere stats. They do not allow you to actually visualize the “app not responding state” and the series of events/user actions that preceded the ANR.
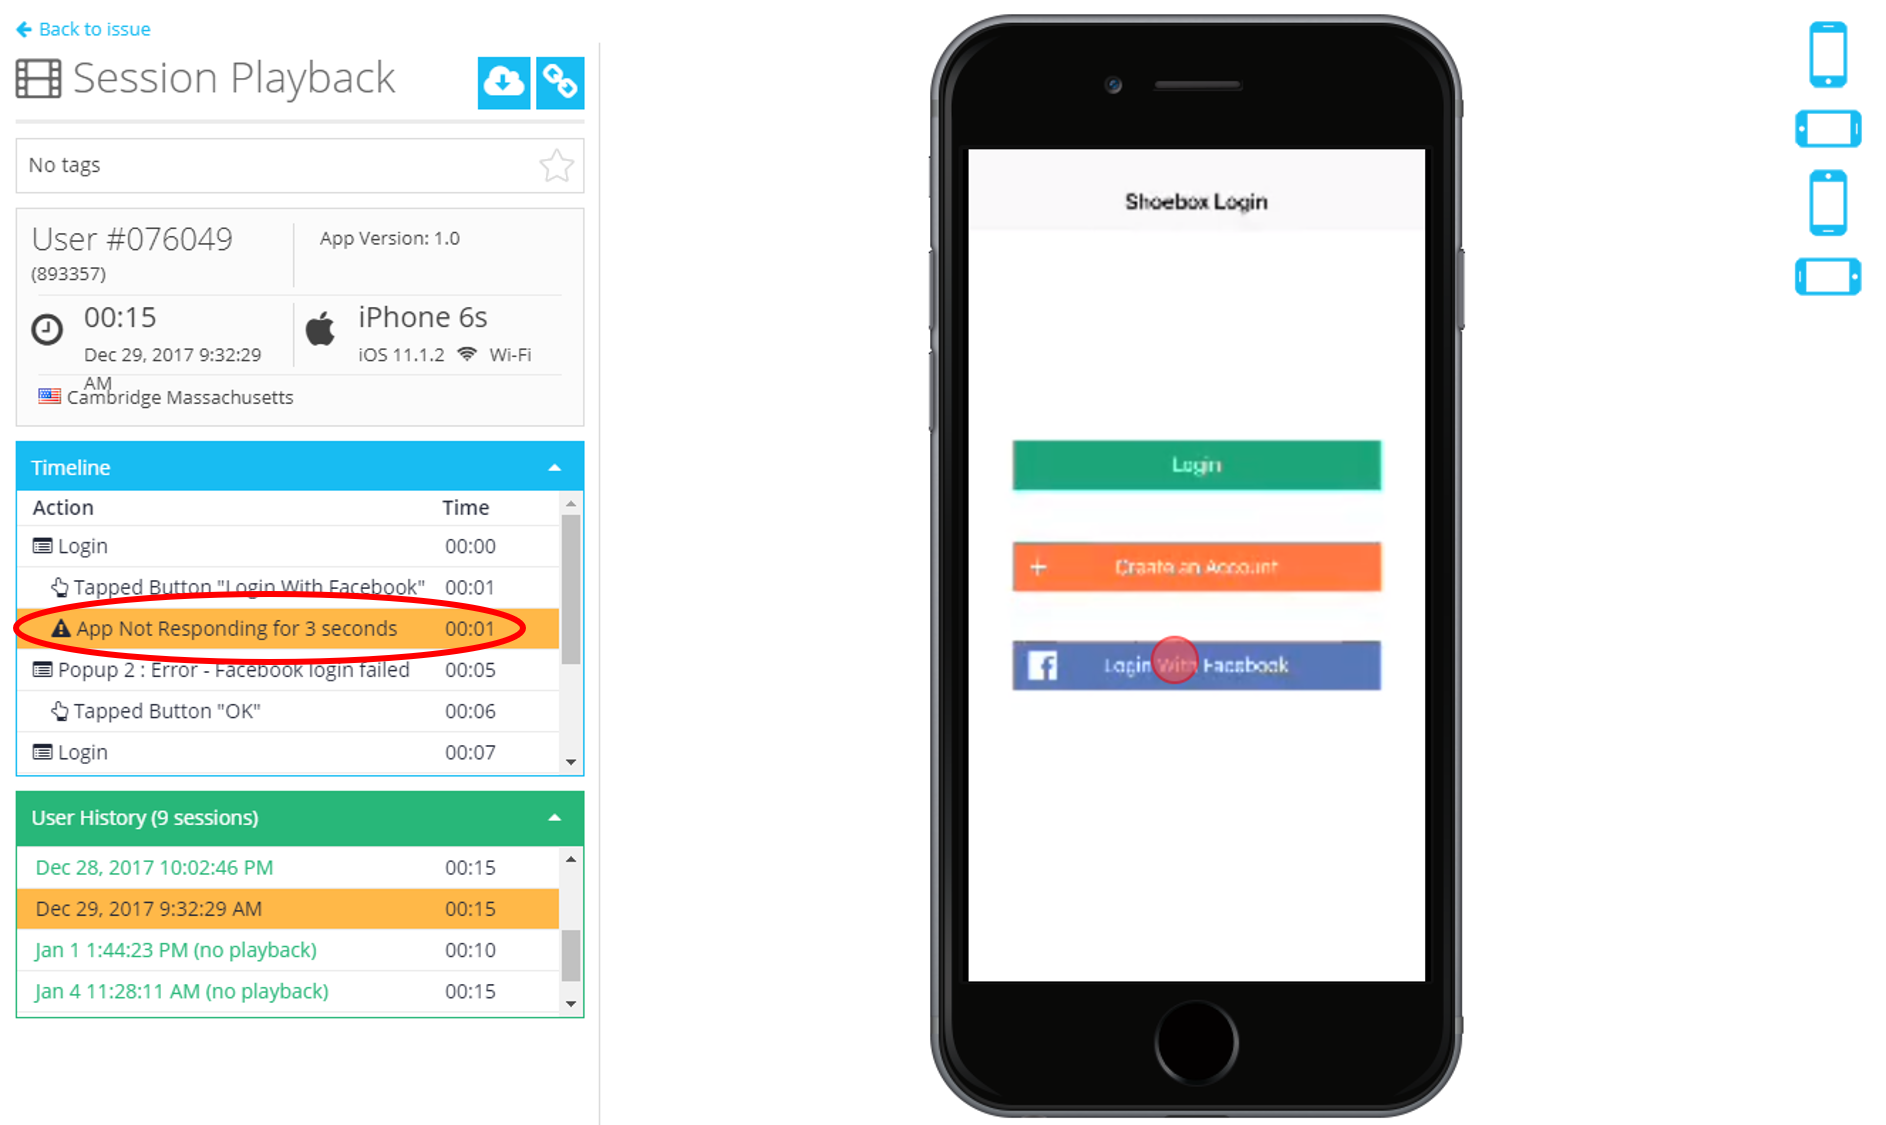
This is where user session recordings step up to the plate. With user recordings, you can watch the real-time in-app experiences of individual users and see the occurrence and length of an ANR issue. Qualitative analytics tools, like Appsee, automatically tag and track every screen and event, and plug this information into an organized timeline paired with the recording. This enables you to precisely follow the order of elements that led up to an ANR and accurately recreate the error. Team communication is also simplified with the ability to share specific recordings via a public link.
From a user behavior standpoint, you can visualize the impact of an ANR on your app’s UX and retention. Did a user demonstrate confusion or frustration after an ANR? Did they quit the app or force kill the session? All of these qualitative, single-user insights are tracked within a user recording. Instead of simply gauging “how many” users were affected by an ANR state, you can also assess how they were affected.
Basically, your quantitative data serves as an alert to ANR trends within your app, and your qualitative data then functions as the investigator. By employing this two-step approach to ANR analysis you will save crucial dev hours, streamline your data-driven workflows, and improve core retention and conversion KPIs.
To try out ANR user recordings and improve app performance, you can grab a free trial with Appsee: