What can you learn about customer engagement from analyzing 5,000 apps? We wanted to find out, so last month, we set off to gather a comprehensive view into how mobile communication and engagement strategies have shifted.
Using data from over 5,000 unique mobile apps of Apptentive’s customers, we packaged our findings in the 2017 Mobile Communication Benchmark Report, which provides a way for companies to understand how their apps’ engagement stacks up against the entire mobile ecosystem. The metrics provide brands with a way to measure the success of their ‘pull’ marketing strategies against industry standards and identify gaps in their customer experience.
Metrics covered in the report include in-app survey response rate, distribution of star ratings in the app stores, customer engagement and responsiveness, and more. It’s a lot to take in, so we recommend downloading your own copy to read and digest all the details. But for those who may need quicker insight into our findings, here are three big takeaways from our research.
1. Survey response rates vary by app category
In-app surveys serve many purposes. Brands use them to conduct mobile focus groups, understand customer satisfaction with their customer experience, and to gain deeper insight into how customers use their app. The value in mobile surveys is tied to the volume of responses, and a higher response rate equals a higher likelihood that the data can be applied more broadly.
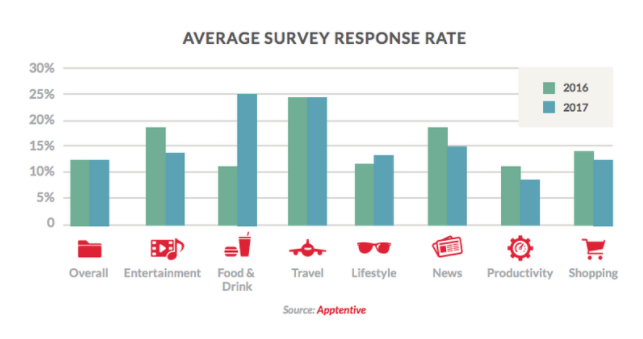
When looking at the average response rate to Apptentive’s in-app surveys, the percentage of responses vary based on app category:
For context, the industry average mobile survey response rate is 1-3%. These percentages are markedly higher across every single app category, which proves that, when kept short and concise, shown at the right time and place in the app, and optimized for mobile, surveys allow you to gather thousands of responses in a short amount of time.The ability to quickly gather a large volume of feedback at scale allows you to make data-driven decisions faster than ever.
2. The opportunity cost of a rating and/or review is bigger than ever
Public app store ratings and reviews are the first impression your app makes on consumers and are crucial in understanding customer sentiment. Not only do they help peel a layer back of how customers feel, they impact your app’s discoverability and conversion rate. In a recent survey we conducted, 77% of respondents reported they read at least one review before downloading a free app, and 80% before downloading a paid app.
It’s important to note that reviews influence more than conversion—they also affect your brand’s overall reputation. In the same survey, 55% of respondents said a one-star or two-star app store rating of a well known brand’s app negatively impacts their view of the brand as a whole, while 71% of respondents said a four-star or five-star app store rating positively impacts their view.
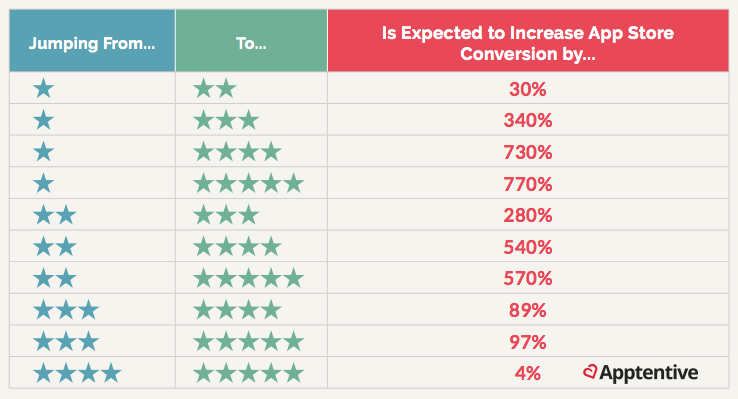
The opportunity cost of a star is huge. How huge? Moving a three-star app to four-stars, for example, can lead to an 89% increase in conversion. For a look at the full opportunity cost analysis, consider the chart below.
3. Two-way messages are imperative to mobile customer success
The gold standard of customer interaction is truly two-way dialog. In 2016, chatbots were a hot topic of conversation and brands responded by being more willing to listen to customers. Brands acted fast, highlighted by the 649% year-over-year increase in the number of apps that enabled two-way conversations and the 56% year-over-year spike in messages sent to consumers. Bots certainly made a splash, but the increase in two-way in-app conversations between consumers and brands proves bots can’t replace real conversations.
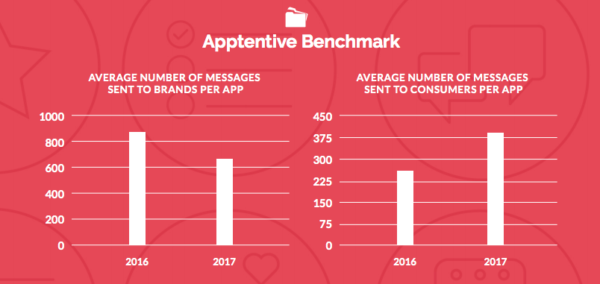
Giving customers the ability to speak to you directly without having to leave the app sends a strong message to customers that you care about what they have to say. Having two-way conversations with customers also affords you the ability to form real relationships with your customers, which fosters loyalty and a deep sense of connection that consumers will want to tell their friends about. Based on our research, here’s how Apptentive customers currently engage their mobile consumers in two-way dialogues within their apps.
The number of apps that use Apptentive’s Message Center increased by 649% year-over-year. That’s a massive acceleration in the adoption of two-way, in-app communication capabilities. An average of 649 messages per app were sent to brands by consumers over the course of a year via Apptentive’s Message Center. For reference, an average of 846 messages per app were sent to brands in 2016’s benchmark.
In the same time period, an average of 384 messages per app were sent by brands in response to consumer messages over the course of a year via Apptentive’s Message Center. For reference, an average of 246 messages per app were sent to consumers in 2016’s benchmark. That’s a 56% increase in messages companies sent to their customers. This rise in the number of messages brands sent to consumers combined with the explosion of apps that adopted Message Center is a signal that brands are investing more heavily in open, two-way dialog with their customers.
Putting it all together
Pulled from over 5,000 apps, the benchmark metrics in our report are meant to provide a clear picture of how your app measures up to the mobile industry as a whole. Collectively, these metrics provide a comprehensive view of the health of your app, how engaged your customers are with your brand, and how well your mobile experience is living up to industry standards.
By comparing your apps’ metrics to the benchmarks listed, you’ll be able to identify which aspects in your customer experience need special attention to meet customer expectations. In the case that your app exceeds some or all of the benchmarks, use your success to continue forging new standards for mobile app experiences and showing customers you care about what they have to say.
We hope this quick snapshot into our findings helps inspire you to place bigger emphasis on in-app customer communication and feedback. To see deeper learnings about this data and more, grab your copy of the full report now!


