A wise man once said, “When your boss’s boss’s boss slacks the marketing team a 30-page report, its contents are probably blog-worthy.”
And that, friends, is why we’re here today.
Merkle just released its quarterly benchmarks, a dense tome detailing the movers and the shakers, the stagnant and the shocking in the world of digital marketing. Think of it like a SOTU but with verifiable facts and less self-aggrandizing clapping (badumbumchhhhhh). Some of the findings presented are easy to digest, others take some ‘splainin, but they all shed light on recent trends that should impact the strategies of every advertiser, regardless of size.
While Merkle’s Q4 DMR covers everything from AdWords and Bing (and their organic equivalents) to Facebook, Pinterest, and even online marketplaces (think Amazon), I’ve trimmed this highlight reel back to include only stats related to paid search and paid social marketing.
Let’s get to it.
Paid Search Marketing Statistics for 2018
1. Across all search platforms, ad spend grew 24% year-over-year in Q4 of 2017, up from 22% growth in Q3.
2. On AdWords, year-over-year search ad spend grew 23%.
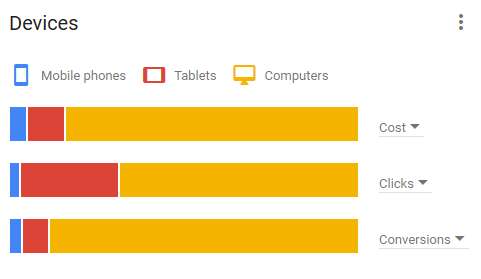
3. Cross-device conversions provided a 12% lift to total online Google search ad conversions attributed to mobile devices in Q4, roughly double the rate for desktops.
4. Average cost per click (CPC) on the Google Search Network spiked 14% in Q4: to the benefit of advertisers, though, this trend shift was met by an improvement in the quality of traffic that Google search ads delivered.
5. Overall click volume on the Google Search Network in Q4 grew 9% year-over-year.
6. Google search ad spending grew 23% overall year-over-year. This figure was significantly impacted by a 32% growth for Shopping ads, while text ad spending rose a more modest 15%.
7. In Q4, Google Search Ad spend allocated explicitly to mobile devices grew 38% year over year; desktop spend grew 21%.
8. Google’s Customer Match, RLSA, and similar audiences products accounted for 30% of Google search ad clicks in Q4 2017, up 10 points from Q4 2016.
9. CPCs for branded keywords on Google fell 13% year-over-year in Q3, but spiked up 23% in Q4.
10. Minimum first page bids for non-brand keywords rose as much as 23% year-over-year in Q4.
11. Ads in position three and four at the top of Google search results pages produced 12% of mobile non-brand text ad clicks in Q4, down from a high of 15% in 2016.
12. The average revenue per click produced by a non-brand Google search ad on desktop improved nearly 20% year-over-year in Q4 2017. To put that into perspective, Q4 2016 posted just 3% year-over-year growth in average revenue per non-branded click.
13. Paralleling US trends, Google search ad click growth in the United Kingdom slowed from 13% year-over-year in Q3 2017 to 5% in Q4.
14. Google Shopping accounted for 55% of retailers’ Google search ad clicks in the US and 58% in the UK.
15. Total Google search ad spend in the UK grew 11% year-over-year in Q4 2017.
16. Search Partner share of Google search ad clicks fell to 5% in Q4.
17. In the B2B sector, advertisers saw average year-over-year growth in Q4 in ad spend (21%), clicks (4%), and CPC (16%).
18. Mobile devices produced 55% of Google search ad clicks in Q4 2017, but just 14% of Bing ads clicks.
19. 49% of ad spend on the Google Display Network in Q4 2017 was allocated to mobile devices and tablets, up from 46% a year prior.
20. Search ad spending across the Bing and Yahoo search ad platforms grew 32% over Q4 2016, a drastic increase from just 6% year-over-year growth in Q3.
21. Bing mobile search traffic was over seven times higher in Q4 2017 than in Q4 2016.
22. Bing Product Ad spend grew 43% year-over-year in Q4.
Key Takeaways
People sure did spend a ton of money on search at the end of 2017!
While this is surely due, in part, to the effectiveness of AdWords in driving leads and sales for businesses across virtually all verticals, it was absolutely influenced by increases in both competition and cost. Fortunately for advertisers, Merkle cites improved traffic quality (the clicks you’re paying for are from actual people, some of whom may very well be interested in your business) and a 20% increase in revenue per click in Q4, which more than offsets the premium paid to ensure your ads are at the top of the SERP.
Mobile was (and will continue to be) a major area of focus for advertisers on both Search and Display; if you haven’t already ensured that your landing pages are optimized for load time and experience on mobile, do so now before those clicks get any pricier. Speaking of major areas of focus…how ‘bout that Bing?! The unfortunately oft-forgotten search engine clearly became a bigger factor for many advertisers in Q4; as you look to diversify your marketing channels in 2018, be sure to give Bing some serious consideration, particularly if you’ve had success advertising on mobile devices in the past.
Finally, I found it interesting that the shift toward audience-centricity in search continued into the end of last year (and will no doubt do so through 2018, too). Intent represents search’s greatest advantage, and the vigor with which advertisers are beginning to lean on audiences (targeting similar groups vs individual search queries) could significantly impact strategy. Using audience profiles to inform targeting on search affords advertisers an additional measure of control and furthers the need for a true cross-platform online advertising strategy. Figuring out how to leverage the audiences you’ve cultivated on Facebook as means of augmenting bids on search or finding net-new prospects on the Display Network will be huge in 2018.
Paid Social Marketing Statistics
23. 82% of all paid social advertising investment was spent on Facebook in Q4.
24. Facebook ads in the News Feed boasted an average CTR of 1.2%, more than 4x that of right rail ads.
25. Ad spend on Facebook increased 20% year-over-year in Q4.
26. 83% of all Facebook ad spend in Q4 went to ads served on mobile devices and tablets.
27. Facebook Spend growth decelerated in Q4, posting just 20% year-over-year growth. This is in stark contrast to the rest of the year, in which ad spend posted growth of more than 40%.
28. Facebook ad impressions declined 27% year-over-year-in Q4.
29. That being said, ad spend on Facebook in Q4 increased 20% year-over-year.
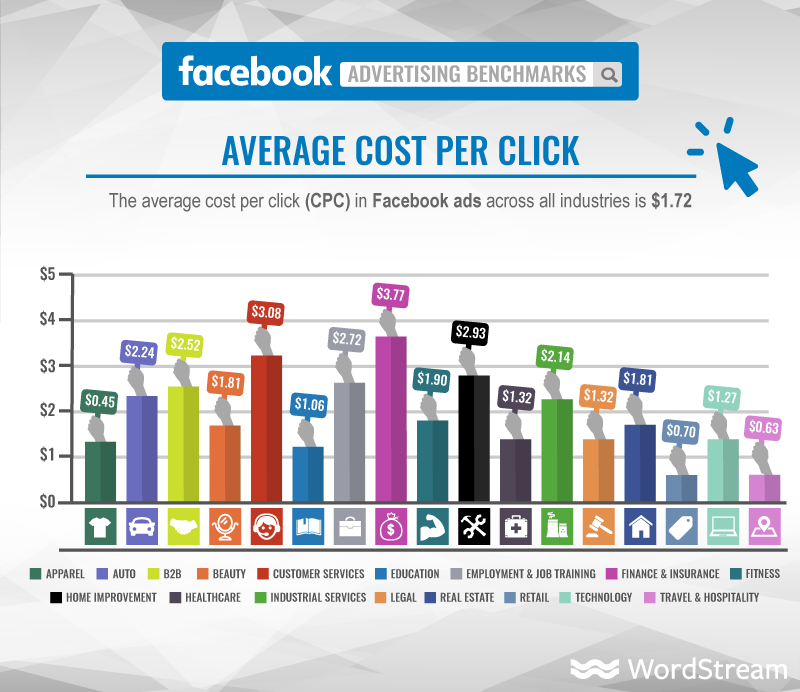
30. The average cost per click for Facebook ads in Q4, regardless of placement, increased 36% year-over-year.
31. Instagram accounted for 8% of paid social ad spend in Q4; Pinterest took 7% of the budget share.
32. Instagram saw significant growth in both inventory (number of available ad types and frequency of placements) and cost, leading to a 122% increase in ad spend year-over-year.
33. Instagram boasted a 99% year-over-year increase in impressions in Q4; CPCs rose 77%.
34. Twitter showed signs of life (reanimation?), inciting a 44% year-over-year increase in ad spend.
35. Twitter also posted year-over-year growth in both impressions (12%) and CPCs (15%) in Q4.
Key Takeaways
Stop me if you’ve heard this one already: Facebook is still king.
Yes, despite, a dip in impressions and a 43% increase in cost per click (per the company’s earnings report) and a kick in the teeth for News Feed ad placements, the social network still saw a massive jump in ad spend. Its dominance in paid social parallels that of Google in search. My point is this: yes, Facebook is going to cost you, but based on its swollen user base and creepily detailed targeting options, you can’t afford not to use it.
Gone are the days of dropping seventy-five cents on a boosted post and seeing some semblance of return. It’s never been more important to ensure you’re optimizing your audiences and ads, targeting the right people with the right creative to avoid paying out the nose for qualified leads. If only there was some way to make that happen without putting life on pause to learn the intricacies of Facebook advertising…
Regarding other popular social advertising channels, Instagram is surging (shocker pause not), Twitter showed signs of life, and LinkedIn….
Yeahhhhhh.
Well, there you have it. If you dug into the rest of Merkle’s report, what compelling conclusions did you draw? If you only skimmed the PPC-centric recap above, how do you see this wealth of data impacting your online advertising decisions in 2018? Let us know in the comments!
