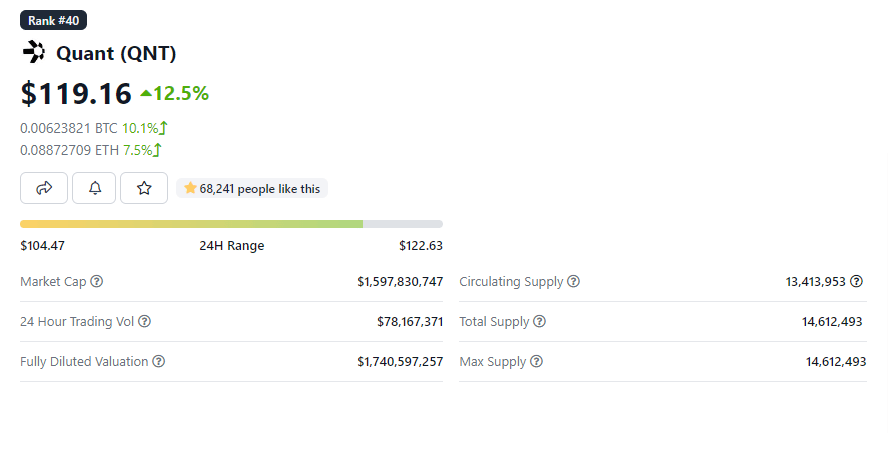
Quant has been on an impressive bull run during the past 24 hours. During this time, QNT has gained by 12.5%, trading at $119.16 at the time of writing. QNT is also up by double-digits over the past two weeks.
Quant makes an 12.5% gain in 24 hours
Quant trades green in the 24-hour charts after a slight uptrend. The gains have allowed QNT to maintain levels above $100, and as it breaks past higher resistance levels, there is a high likelihood that the bullish sentiment will be maintained.

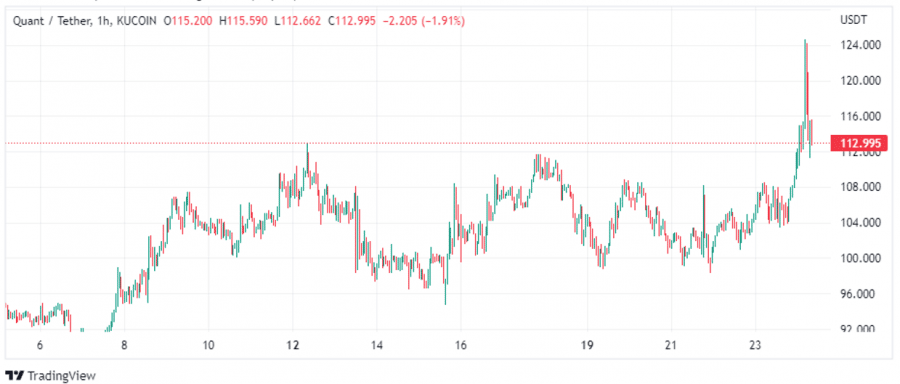
As seen from this month’s chart (above), QNT has been on a remarkable bull run, allowing it to outperform most of the market. During this uptrend, QNT peaked at $124 before the bears swarmed into the market again and dropped to lower levels.
QNT tested the $120 resistance level before being rejected to the current price of $114. However, there is no certainty that the bulls will maintain their position because a bearish sentiment is still looming.
The broader market is still consolidating, and for QNT to break the bears, it needs to test the $120 levels again and break to new highs of $150. Such an uptrend is possible, as it would follow the momentum that QNT has created over the past week. However, bears seem to persist as the price indicators show that further declines could be on the way.

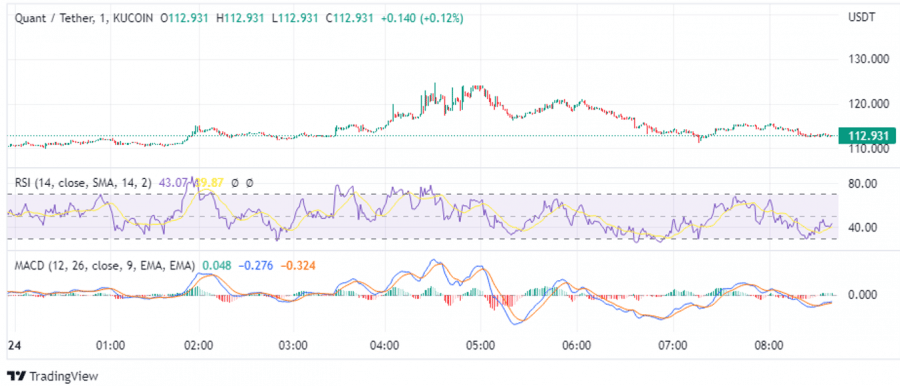
The Relative Strength Index (RSI) shows that the price momentum is bearish. The indicator stands at 39, signaling that selling pressure is building up. If the selling pressure keeps up, QNT will likely drop further and test lower support levels below $110.
However, the RSI flashing below the 40 levels could indicate that a reversal is on the way. Therefore, as the tension between the bulls and the bears grows, QNT could consolidate between the $100 and the $120 levels.
The Moving Average Convergence Divergence (MACD) further strengthens the bearish sentiment. The MACD line is below the signal line, showing that the price is still bearish. However, the MACD line shows an uptrend, signaling that the bulls and bears are fighting for control.
With the two indicators pointing toward a bearish trend, QNT’s price will most likely go below the $100 level in the short term. Quant has been one of the best cryptos to invest in this month, but with the uptrend cooling down, traders will likely look for the next gainer.
QNT has the potential for long-term growth despite the volatility that has intensified over the past few months. New investors in the token and the existing token holders can HODL for the long term as they await gains in the long term, as the token gains utility.
The Quant project was created to promote interoperability. It also provides efficiency in transaction processing. One of the factors making Quant unique is that it was created to allow communication between blockchains, which has been needed by the blockchain industry for the longest time.
Quant reached an all-time high of $427 in September last year. QNT has since dropped by 73% from these record highs.
Related
- What is Quant Trading? A Beginner’s Guide for September 2022
- Where to Buy Quant in 2022
- How to Earn Free Crypto
Tamadoge - The Play to Earn Dogecoin
- '10x - 50x Potential' - CNBC Report
- Deflationary, Low Supply - 2 Billion
- Listed on Bybit, OKX, Bitmart, LBank, MEXC, Uniswap
- Move to Earn, Metaverse Integration on Roadmap
- NFT Doge Pets - Potential for Mass Adoption