Ether, the primary token of the largest smart contracts Ecosystem, is bleeding along with its peers led by Bitcoin, the world’s most prominent crypto, as it corrects below $30,000. Ethereum price is trading 6% down on the day at $1,985 just four days after exploding to an 11-month high of $2,140.
The Vitalik Buterin co-founded token reacted positively to the much-publicized Shapella upgrade on April 12, adding $280 to its value in a few days.
Meanwhile, Bitcoin is back to trading below $30,000 barely a day after reclaiming the same support level.
The largest crypto has since March, in the heat of the banking crisis in the United States, performed exceptionally well—and even surpassed market watchers’ expectations.
Bitcoin has impeccably strengthened its technical outlook, supported by improving fundamentals, becoming the best-performing asset globally year-to-date.
By the end of Q1 2023, Bitcoin had gained 70% more, marking the most rewarding quarter for the digital asset since March 2021. At the time, Bitcoin gained around 103% in three months.
The S&P 500’s performance in 2023 is nowhere near the gains crypto investors have witnessed, at 5.5%. Other indexes like the Nasdaq 100 ticked up 19% at the end of the first quarter while the iShares 20+ Year Treasury bill had returned a 5.3% gain.
Ethereum Price Technical Outlook In the Wake of Shapella
Ethereum price could be lagging compared to Bitcoin, but its performance also dwarfs all traditional asset classes at 33% by the end of Q1 2023.
One factor that has contributed immensely to Ether’s bullish outlook is the Shapella software upgrade.
As investors who staked ETH tokens in the Beacon Chain smart contracts waited anxiously for the upgrade to allow them to withdraw their funds and the rewards earned, many market participants booked positions to capitalize on the expected volatility around the hard fork.
On April 12, Ethereum was reborn as a full proof-of-stake protocol, allowing investors to stake and withdraw their tokens as they so wish.
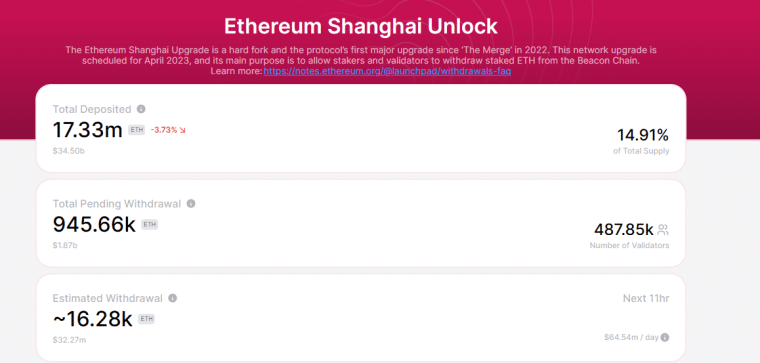
Pending withdrawals had been estimated to be more than $3 billion, approximately 1.48 million Ether by April 15 – data provided by TokenUnlocks.
As per the current data on the platform, total pending withdrawals have dropped to 945k ETH, worth around $1.87 billion, accounted for by 477 validators. So far roughly 16k ETH has been withdrawn successfully worth around $32 million.

The uptick in Ethereum price following the Shapella upgrade left some people surprised as they expected the event to turn bearish. Grayscale’s Matt Maximo and Michael Zhao recently assured investors that “withdrawals do not necessarily signal selling.” Validators may be withdrawing to switch between staking providers.
“Although withdrawals might continue to grow in the near term, withdrawals do not necessarily signal selling, as users could be rotating validators or switching to staking providers that offer higher yields,” Matt Maximo and Michael Zhao said in a statement.
The analysts believe that the Shanghai upgrade was “a bullish event for Ethereum,” attributing the gains to the seemingly gradual withdrawal process.
Furthermore, investors on some staking platforms like Coinbase and Lido may have to wait between two and several months before their withdrawal requests are completed.
“We believe that the short-term price impact from the Shanghai upgrade will be less severe than initially anticipated, attributable to the lower number of ETH withdrawals and full exits,” they added with optimism. “Looking ahead, we think this is a bullish event for Ethereum, as reducing staking risks could boost the baseline demand for ETH.”
Ethereum In Rush To Secure Support – Should You Buy The Dip?
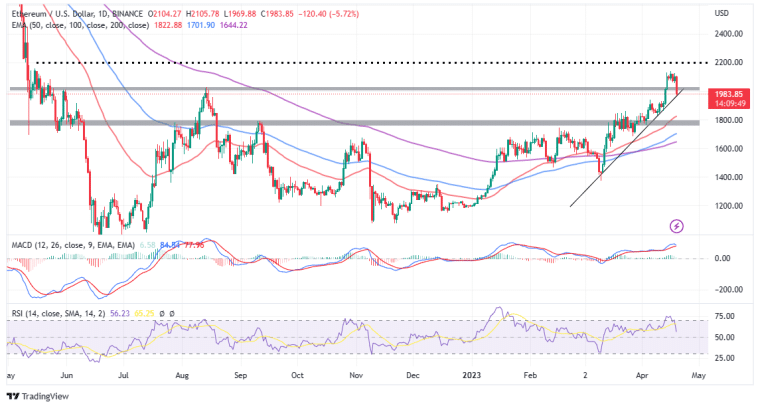
After climbing to $2,140 for the first time since May 2022 Ethereum is back to trading below $2,000. Attempts by bulls to uphold support short-term support at $2,000 went down the drain and now ETH trades at $1,982 while seeking support at a critical ascending trendline, as observed on the daily chart.
If the largest smart contracts token overshoots the rising trendline, investors can acclimatize to an elongated correction.

The position of the Relative Strength Index (RSI) after dropping from the overbought area into the neutral region implies that buyers have the upper hand at the moment.
The same bearish outlook can be validated by an imminent sell signal from the Moving Average Convergence Divergence (MACD) indicator.
Traders looking forward to triggering short positions in ETH may want to wait until the MACD line in blue crosses below the signal line in red.
In addition to that, the price must be below the ascending trendline to avoid sudden bear traps.
Price action below the rising trendline could let all hell break lose, with Ethereum price likely forced to seek relief at $1,850 and $1,800. The latter is an area reinforced by the presence of the 50-day Exponential Moving Average (EMA) (line in red).
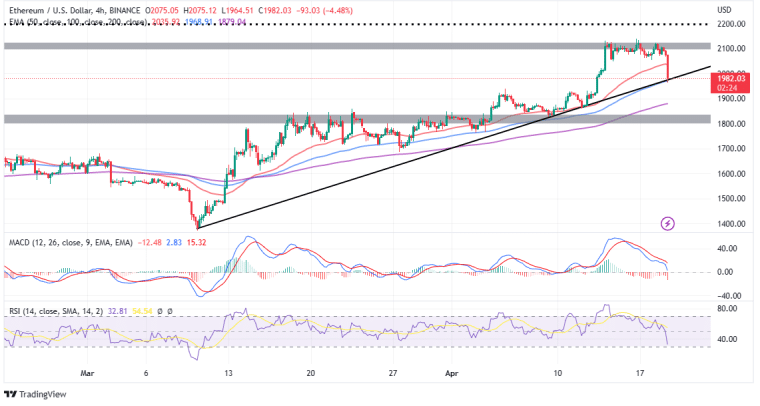
Although the MACD and the RSI are painting a worrying picture on the four-hour chart, it is possible buyers will arrest the bearish situation at $1,986, which is confluence support formed by the 100-day EMA and the same ascending trendline referred to on the daily chart.

Investors who may have sold Ether as the price dropped from the 11-month high are likely to be waiting on the sidelines for an uptick confirmation above $2,000 before buying back the same tokens.
In other words, the idea of Ethereum closing the gap to $3,000 is not farfetched and can still hold water, as long as bulls can reclaim its position above $2,000.
Following the potential move above $2,000 traders will be looking forward to the next jump past $2,200 to add credence to the bullish outlook targeting $3,000.
Love Hate Inu - Next Big Meme Coin
- First Web3 Vote to Earn Platform
- Latest Meme Coin to List on OKX
- Staking Rewards
- Vote on Current Topics and Earn $LHINU Tokens