Cryptocurrency markets are showing signs of recovery early in the New Year, with Bitcoin price holding above critical support at $16,500. Investors are mulling over the assets to add or push out their holdings.
BTC will likely remain on many crypto portfolios despite fears it is yet to bottom. The largest crypto dodders at $16,705 at the time of writing as bulls expand their gaze to areas above $18,000 and $20,000, respectively.
Bitcoin Price Eyes Rebound from the 2022 Brutal Sell-off
According to Rekt Capital, an anonymous group of crypto analysts on Twitter, Bitcoin price tends to post a new all-time high every cycle. Each cycle is four years long and centered around Bitcoin halving.
Rekt Capital explained to over 331k followers that a new all-time high is expected at the end of 2024 and in 2025. Such a move implies a more than 300% return in less than two years, considering the current price of $16,705.
The stability investors have witnessed over the last few weeks, with Bitcoin price holding above $16,000 and $16,500, could signal a potential recovery in 2023. According to Santiment, one of the leading blockchain analytics platforms, history could have helped investors predict the outcome of Bitcoin price in 2022 based on its four-year cycles.
Santiment’s data reveals that Bitcoin achieved +5,507% in annual returns in 2013, +1,218% in 2017, and +60% in 2021. On the other hand, BTC saw -59% in annual returns in 2014, -72% in 2018 and -65% in 2022. Therefore, investors could expect better performance in 2023 compared to 2023, with Bitcoin expected to break out substantially in 2024 and 2025.
The blockchain data analytics platform further pointed out that Bitcoin “still requires some increases in network utility to justify current market caps,” as per its NVT price prediction model. The network circulation must pick up the pace in 2023, with the days following the holidays likely to play a key role.
Bitcoin Price Builds Momentum for a Breakout
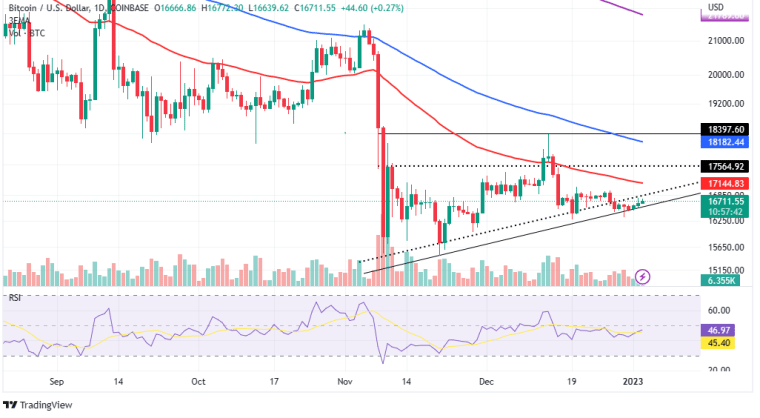
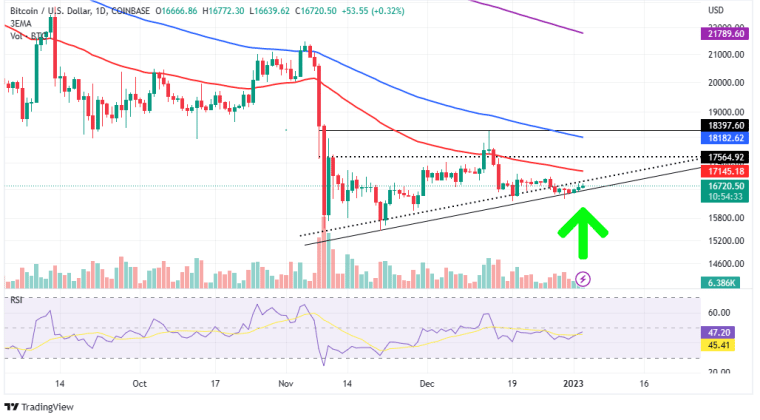
Bitcoin price is holding above a crucial rising trendline (continuous line), intending to reclaim the ground above $17,000 and preferably the hurdle presented by the 50-day Exponential Moving Average (EMA) at $17,144.
The Relative Strength Index (RSI) position as it gradually moves toward the overbought region (between 70.00 and 100.00) reveals that the path with the least resistance remains to the upside. Remember that the RSI (in purple) currently holds above the moving average (in yellow). A break above the rising dotted trendline is necessary to pave the way for the anticipated breakout.

Traders looking forward to longing Bitcoin in the short-term must wait for a clear break above the $17,000, if not the 50-day EMA for possible take-profit targets at the 100-day EMA (in blue) at $18,182 and the 200-day EMA (in purple) at $21,789.
What Could Be Stifling BTC’s Recovery
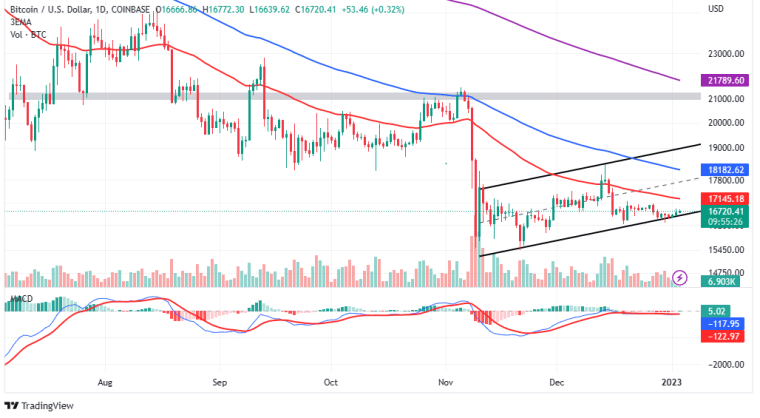
Bitcoin is holding below all the major moving averages, starting with the 50-day EMA at $17,145, the 100-day EMA at $18,182 and the 200-day EMA at $21,279, as shown on the four-hour timeframe chart.
The price must hold above the rising channel’s lower boundary support to avert a potential sell-off to $15,450. Still, on the upside, Bitcoin must overcome resistance at the 50-day EMA to validate movement to highs around $18,182 and $21,789, respectively.

Analysts at Rekt Capital believe Bitcoin price staying below key resistance at $17,300 despite the market-wide bounce this week could spell doom in the coming days. As analyzed by Rekt Capital, declines below $16,000 might hit support at $15,450 and stretch the leg to $13,910.
Key Takeaways:
BTC current price: $16,605.
General Trend: Bullish.
Key Resistance areas: $17,145, $17,300 and $18,182.
Key Support Areas: $16,000, $15,450 and $13,910.
RSI: Bullish on the daily chart.

