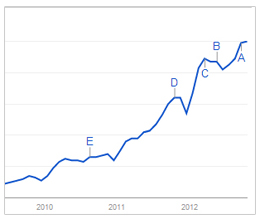
 The use of infographics as a content marketing strategy has been gaining steam since late 2010. By incorporating infographics into your marketing mix, you can achieve additional online visibility as well as increased brand awareness.
In order to maximize the online visibility of your infographic, you need to understand that you will need to not only optimize the page that hosts the image, but the image itself. I have put together some strategies to help assist you in your next infographic promotion campaign.
Publish the infographic on your own site first.
I see a lot of marketers/business owners first publish their infographic on a third-party platform like Visual.ly or Pinterest. They then create a blog post on their own site and point any referencing URLs to the third-party hosted version of the infographic. This is wrong!
You want your site to be credited first for the image and content (more on that below). Being the first to publish gives you a better chance as being labeled the “original publisher” and it will help you out rank any other site that may republished the infographic.
You should also include the authorship markup that utilizes the rel= attribute to identify yourself as the original author. Currently, Google acknowledges the use of rel=”author” and rel=”me” links to create a link between the post and the author. You can find more information on how to implement these authorship tags here.
Make sure it is indexed before you start to syndicate the infographic.
Your site may not be the most authoritative site on the Internet, but the search engines will still index your new content quickly. To check to see if your page has been indexed you can use the “site:domain.com/url-of-the-page/” (no quotes) in the Google or Bing search box. If in doubt you can always ask Google or Bing to crawl your page.
Use basic image SEO 101 tactics.
Some of the basic image optimization tactics are:
- Use an image file name that is closely related to the image’s content. It is a best practice to use hyphens to separate keywords within the name. Also use all lower case letters (including the file extension). For further information on this please read 11 Best Practices For URLs.
- Use the ALT attribute (alt=”an description of the image”) to describe the image. The description should accurately describe the image for the end user while incorporating your targeted keywords.
- Use targeted keywords relating to the image within the content around it. This includes the page title, meta description, heading tags and body content.
Use CDN to host your site images
If you have a high traffic site or are expecting to generate a surge in traffic to your site from your infographic, you may want to consider using a Content Delivery Network (CDN). A CDN can improve page loading performance. This is an advanced tactic and there can be serious implications to your SEO efforts if it is not implemented correctly. You may want to reference this article, Amazon S3 Without SEO Issues.
Increase social sharing opportunities
By allowing others to either embed or to easily share the infographic can help you build the page authority quickly. I am going to discuss three tactics that will help extend your infographic’s social reach and allow you to increase your rankings.
Social sharing buttons
By adding social share buttons to the page you will provide an easy way for your site visitors to share the infographic. You will want to at least provide a Facebook, Twitter, LinkedIn, Pinterest, and a share by email option. There may be other niche social networking sites that may work better for you, but just do not overwhelm the user with too many options.
Include a social-ready thumbnail
Including a thumbnail of the infographic is an overlooked tactic that many content marketers need to incorporate into each blog post. The thumbnail will be used when someone attempts to share the infographic page on such social networking sites like Facebook or Google Plus. Typically the infographic images are too large and the social network will not render a preview image in the shared post. The thumbnail size I recommend using is 150px X 150px. I typically will place the thumbnail image at the bottom of the page.
Embed code
Add an “Embed This” feature that will allow others to embed your infographic onto their blog or site. The “Embed This” code can be a bit techie for some and you can find a easy to use embed code generator to help create it for you or if you have WordPress the embed code generator plugin is recommended.
Provide chunkable, tweetable statements
Another social sharing strategy is to use chunkable, tweetable statements from your infographic. There is a free tool called ClickToTweet that will help you generate a link that will allow your users to effortlessly tweet your infographic data snippets. You will also want to use a scheduling tool like HootSuite or Buffer to post these infographic data snippets to your own social networking timelines.
Using these tactics will help you to realize the full potential of your infographic. Do you have any other optimization tactics that you use?