The number one reason businesses fail is that they run out of money – even if they’re profitable. So how can businesses, lenders, and investors predict and prevent financial disaster? The balance sheet is helpful, but liquidity metrics like the current ratio give a much clearer picture of a company’s ability to meet financial obligations and stay solvent. Here’s our guide to calculating and interpreting your company’s current ratio with in-depth examples.
What Is the Current Ratio?
The current ratio measures a company’s ability to pay short-term obligations using its current assets. It’s simply a measure of a company’s liquidity. It is also known as the working capital ratio.
This metric compares a company’s current assets to its short-term liabilities in order to test how well the two variables are balanced.
The current ratio formula is as simple as it gets: current assets/current liabilities.

Why Is the Current Ratio Useful?
The current ratio is used by:
- Banks and other lenders to assess the likelihood that a company will default on debt.
- Investors to assess the risk involved in investing in a business.
- Business owners and managers to assess a company’s financial health.
What Is a Good Current Ratio?
Generally speaking, a ratio of:
- 1-3 is desirable
- <1 is concerning
- >3 raises major questions about asset utilization
A current ratio of 2 means a company has $2 of current assets for every $1 of current liabilities and could cover its current liabilities twice over with its current assets. This is healthy.
A current ratio of 0.5, meanwhile, indicates that a company could only cover half its current liabilities with current assets. This puts them at risk of insolvency.
A very high current ratio suggests a company is carrying too much cash instead of investing in the growth of the business.
How to Analyze a Current Ratio
There are two important factors to consider when analyzing a company’s current ratio.
1. Current ratio varies by industry.
The ideal current ratio differs from industry to industry and sector to sector because of factors like inventory turnover, asset requirements, cash flow, and payment cycles. Industries also face unique challenges that could impact current ratio such as supply chain disruptions. A current ratio in line with the industry average or slightly higher is desirable.
2. Current ratio fluctuates over time.
A bulk inventory order, annual executive bonus payouts, or a big upfront payment from a major client could temporarily skew the current ratio. It’s best to calculate your current ratio monthly to see trends rather than ‘snapshots’ and spot problems early.
How to Calculate the Current Ratio
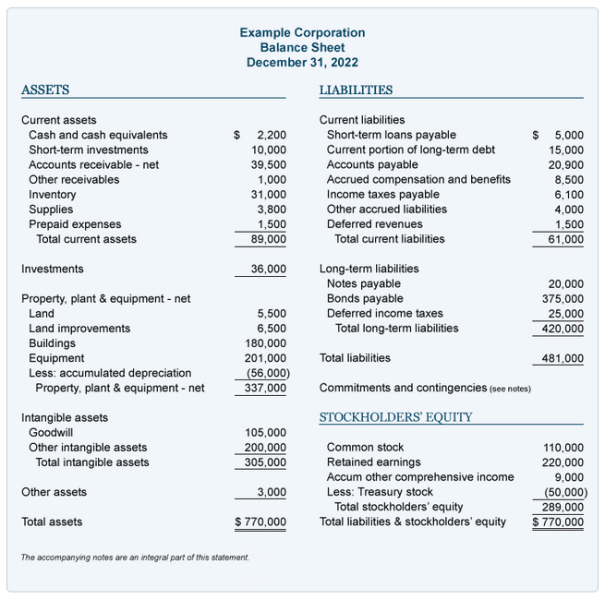
Let’s take a look at the variables that make up the current ratio. Everything you need can be found on a company’s balance sheet.
Current Assets
Current assets are assets that can easily be converted into cash within one year. These are assets that could be used to pay short-term obligations. They include:
- cash and cash equivalents
- short-term investments
- accounts receivable i.e. money owed to the company by customers
- inventory
- prepaid expenses like insurance
Current Liabilities
Current liabilities are financial obligations that will be due within one year. These pose an urgent existential risk to a business without the necessary cash. They include:
- Short-term loans
- Portions of long-term debt that are due within a year
- Accounts payable i.e. money owed to suppliers or vendors for goods or services already received
- Income taxes
- Employee compensation
- Deferred revenues like unused gift vouchers
Examples of Current Ratio
Let’s look at how you can use the current ratio to assess a company’s financial health.
Example 1: Starbucks
According to Starbucks’ balance sheet, in October 2023, the coffee chain had total current assets of $7,303 million and total current liabilities of $9,354 million. We can see just by looking at these numbers that Starbucks’ current ratio is below one because there are more liabilities than assets.
To calculate the current ratio, we can use the current ratio formula: current assets/current liabilities.
Current ratio = 7,303/9,354 = approx. 0.78
Here are Starbucks’ current ratios for earlier years.
- 2022: 0.76
- 2021: 1.19
- 2020: 1.06
- 2019: 0.91
- 2018: 2.19
The two latest ratios are the lowest in recent years. They are also below 1, meaning Starbucks could not pay all its current liabilities using its current assets. Restaurants tend to have relatively low current ratios, but the industry has a five-year average of 1.1, which means Starbucks is below average.
To get the full picture, we need to compare Starbucks to its competitors. We can look at data for 2022 in annual reports from Restaurant Brand International (RBI), the parent company of Tim Hortons, and McDonald’s, which owns Starbucks’ competitor McCafe.
| Company | Current assets | Current liabilities | Current ratio (approx.) |
| RBI | $2,048 million | $2,116 million | 0.96 |
| McDonald’s | $5,424 million | $3,802 million | 1.42 |
Starbucks has a lower ratio than both competitors, which is a red flag. This could be because Starbucks coffee is more expensive and consumers are feeling pessimistic about the economy, driving revenue down below expected levels.
However, Starbucks has good long-term prospects. Because of its size and brand value, it will likely be able to borrow against those to cover these short-term liabilities. The company also survived the pandemic, which suggests resilience. Current ratios this low for a small business in a similar situation might not be tenable without the size and resilience of a major nationwide brand.
Example 2: Charlie’s Cars
Car sales company Charlie’s Cars has the following data.
| Month | Current assets ($) | Current liability ($) | Current ratio (approx.) |
| January | 850,000 | 800,000 | 1.06 |
| February | 900,000 | 800,000 | 1.13 |
| March | 700,000 | 550,000 | 1.27 |
| April | 1,100,000 | 950,000 | 1.16 |
| May | 1,180,000 | 950,000 | 1.24 |
| June | 1,260,000 | 550,000 | 2.29 |
| July | 1,660,000 | 950,000 | 1.75 |
| August | 1,700,000 | 950,000 | 1.79 |
| September | 1,320,000 | 550,000 | 2.40 |
| October | 1,770,000 | 1,000,000 | 1.77 |
| November | 1,870,000 | 1,000,000 | 1.87 |
| December | 1,470,000 | 500,000 | 2.94 |
The company’s current ratio fluctuates a lot. On the balance sheet, we can see bulk inventory deliveries in January, April, July, and October. The inventory was not paid for immediately, so it added an equal amount to total current assets and total current liabilities in those months.
As cars were sold, the inventory was converted into cash, including a profit. Therefore, in February, May, August, and November, current assets increased a little along with the current ratio.
Two months after the deliveries, Charlie’s Cars used cash to pay for the inventory. This decreased both assets and liabilities equally.
Charlie’s Cars is growing, so every inventory order was bigger than the last, leaving more profit in the bank. That’s why the current ratio increased over the year.
The company’s ratio is always above one, but how would Charlie’s Cars compare to a real car dealership? The balance sheet below comes from a Toyota dealership.
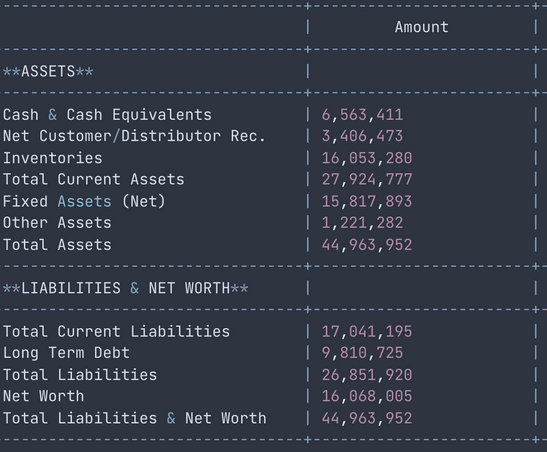
Current Ratio = current assets/current liabilities = 27,924,777 / 17,041,195 ≈ 1.64
This suggests that Charlie’s Cars is in good financial health, at least in this regard. Of course, the current ratio isn’t perfect and isn’t the only important financial metric to watch.
How to Improve Your Current Ratio
Here are some of the measures that companies can take to improve their current ratio.
- Delay purchases of non-current assets.
- Sell non-current assets that are not generating returns.
- Make operational changes to increase cash flow.
- Switch to cheaper suppliers to reduce accounts payable.
- Reduce the salary burden.
- Renegotiate loan repayment schedules.
- Find tax-saving opportunities.
- Switch from annual to monthly subscriptions to delay prepaid expenses.
What Are the Limitations of the Current Ratio?
The benchmark for a good current ratio differs from industry to industry. This means that the current ratio is mostly only useful for comparing companies in the same industry or sector.
The current ratio also lacks specificity. Because it includes all of a company’s current assets, it does not distinguish between, for example, unwanted inventory and cash, but cash is a better indicator of liquidity. Therefore, it’s wise to look at the current ratio in conjunction with cash flow or the quick ratio.
Current Ratio vs. Quick Ratio
Both the quick ratio (also known as the acid test ratio) and the current ratio measure a company’s ability to cover its current liabilities using current assets. While the current ratio considers all current assets, the quick ratio excludes inventory.
This makes the quick ratio a better indication of how easily a business will cover its current obligations in the face of dramatic change (e.g. a market shock) because, in an emergency, inventory may take too long to sell.
Prepaid expenses are also sometimes excluded from the quick ratio.
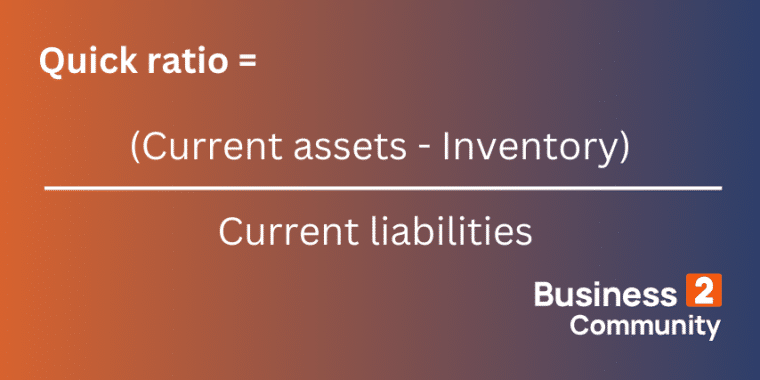
The quick ratio formula is (current assets – inventory)/current liabilities.
Other Useful Liquidity Ratios
Here are some other financial ratios that are useful for assessing a company’s liquidity.
Cash Asset Ratio
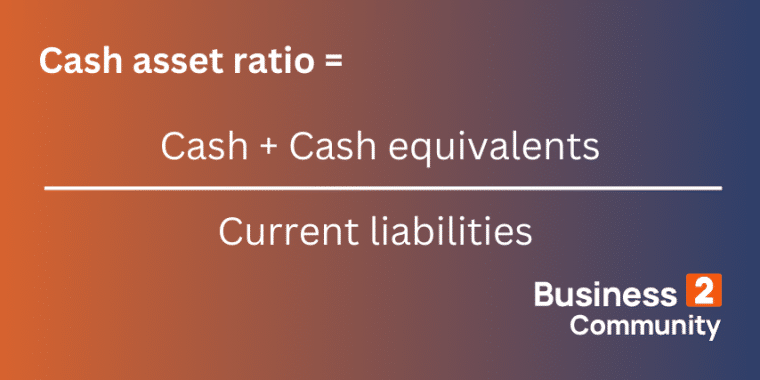
The cash asset ratio, also known as the cash ratio, compares a company’s cash and cash equivalents to its current liabilities.
While the current ratio looks at total current assets, the cash ratio looks only at the most liquid current assets. Therefore, cash asset ratio is a more conservative measure.
A company with a cash asset ratio of 1 or more can cover all its short-term liabilities with its cash and cash equivalents, signaling good financial health.
Days Sales Outstanding
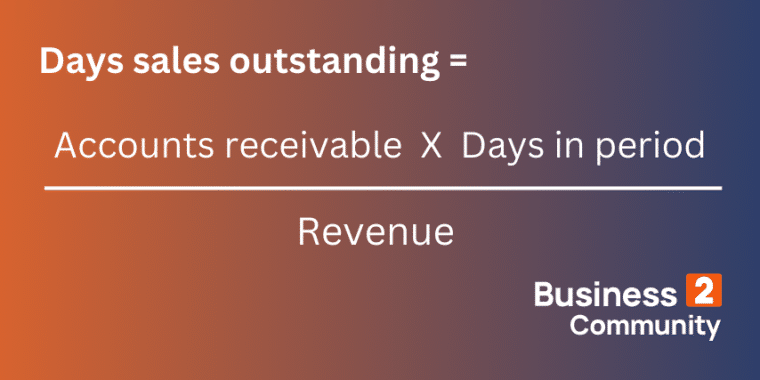
Days sales outstanding (DSO) is the number of days it takes for a business to get paid after an invoice has been sent to a customer. It indicates how quickly a business can generate income to cover debts.
It is useful to compare DSO to an industry average. For example, the industry benchmark for business services is 41.07 days and the benchmark for food products is 23.74.
You can improve your DSO by tackling late payments or renegotiating contracts.
Operating Cash Flow Ratio
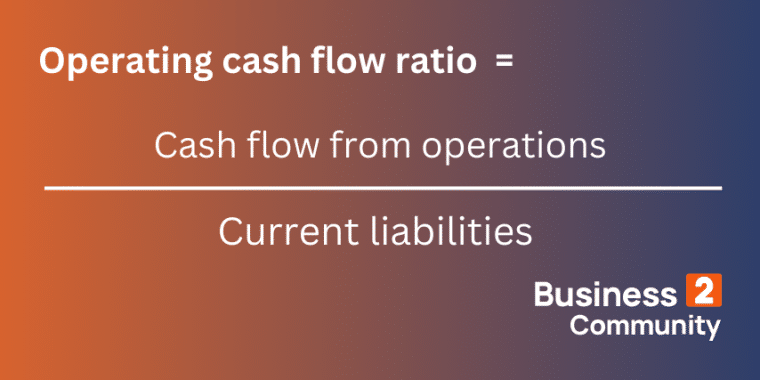
Operating cash flow (OCF) is the cash generated by the normal activities of a business over a specified period. A company needs OCF to fund its daily operations. This cash could also be used to cover short-term debts. Therefore, the OCF ratio is a measure of liquidity and financial health.
An OCF ratio of 1 or more is desirable because it means a company can cover all its current liabilities using income generated in the given period.
Stay On Top of Your Liabilities With the Current Ratio
A profitable company with a strong business model and plenty of assets shouldn’t go bust, but if short-term obligations are mismanaged, the problem can quickly snowball. Relationships with suppliers and employees can be damaged by late payments. Fines and fees on overdue taxes and loan payments can accumulate. It can become difficult to raise capital. These risks may be obscured by strong profits and good long-term solvency, but the current ratio offers a clearer picture of a company’s liquidity.
