What Is the Dividend Payout Ratio?
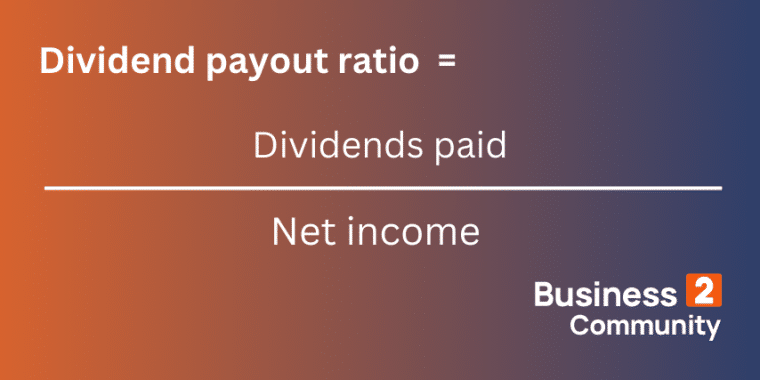
The dividend payout ratio (also known as payout ratio) compares the dividends paid out to shareholders to the company’s net earnings. It is often represented as a percentage.
Dividends are a portion of a company’s profits that are distributed to shareholders as a reward for investing in the business.
When companies with shareholders generate an income, they have three options.
- Pay all the income to shareholders as dividends.
- Put all the money back into the business to pay off debt, invest in future growth, or store as cash reserves.
- Pay out some of the income as dividends and put the rest back into the business.
This decision is usually made by the board of directors and depends on factors like performance, the growth stage of the business, and shareholder preferences.
Did you know? The dividend payout ratio can signal the stability of a company’s dividends. A stable or moderately increasing payout ratio suggests a sustainable dividend policy, whereas erratic changes may indicate potential dividend cuts or financial instability.
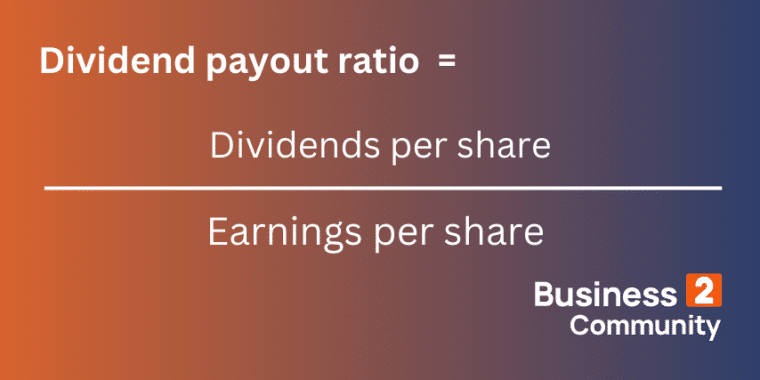
Recommendation: Already know what you’re doing and just want to get to calculating? Just scroll down to our dividend payout calculator below. The dividend payout ratio formula is the amount of dividends paid to shareholders divided by net income for the same period. Dividend payout ratio is also sometimes calculated on a per-share basis. Ready to start calculating? Just make sure that your data is up-to-date and accurate. Next, plug in your data into your preferred dividend payout ratio calculator below and his calculate. Once you have your final answer, move on to the section below for insights on how to interpret it. A ‘good’ dividend payout ratio is dependent on industry, the growth stage of the business, shareholder expectations, cash flow, debt, and capital expenditure requirements. Let’s look at some dividend payout ratios and what they indicate. A negative dividend payout ratio means a company pays dividends even though it is making a loss. A company may choose to do this to meet shareholder expectations if it has a history of paying consistent dividends. However, this may be a bad sign as a company with a negative net income will be cutting into its bottom line to pay dividends. A dividend payout ratio of 0-35% is generally good, especially for: Amazon and Google don’t pay dividends, preferring instead to invest in innovation. Meta will make its first dividend payments in 2024 at a payout ratio of around 12%. Although this is a lower dividend payout ratio, Meta is still considered by many to be a good investment. Such companies tend to attract growth investors. A dividend payout ratio of 35-50% is generally considered healthy. Established, industry-leading companies tend to have dividend payout ratios in this range. For example, Microsoft’s dividend payout ratio has ranged from 25 to 56% over the past 10 years, and Walmart’s payout ratio is 37%. Companies like these tend to be good investments for what’s known as dividend investors or income investors rather than growth investors, who are more focused on long-term growth. A ratio from 50-75% is generally considered to be a high payout ratio and potentially unsustainable with the exception of sectors like utilities and consumer staples. British American Tobacco, for example, falls into this range as does utility company National Grid. These kinds of companies may not have great opportunities to invest the funds so they decide to pay the shareholders more instead. Ratios of 75%+ are very high payout ratios. Investors should be aware that it is likely to decrease in the future. This is concerning because cutting dividends often results in a sharp decline in stock price because of the decreased value for investors. A dividend payout ratio of more than 100% means the amount of dividends paid is higher than the company’s net income. This means the company has no retained earnings and is digging into its bottom line to pay for dividends which is unsustainable for almost all companies. Coca-Cola, for example, had a payout ratio of over 100% throughout 2019, but the company has since brought its ratio down to the 65-75% range. Presumably, it was not possible to continue with the higher dividend payout ratios. Here are the average dividend payout ratios for ten sectors, according to CSI Market.Key Takeaways: Dividend Payout Ratio
The Dividend Payout Ratio Formula
Dividend Payout Ratio Calculator
What is a Good Dividend Payout Ratio?
Low Dividend Payout Ratio
‘Safe’ Dividend Payout Ratio
High Dividend Payout Ratio
Industry Benchmarks
Sector
Average Dividend Payout (%)
Conglomerates
98
Consumer (non-cyclical)
80
Utilities
80
Basic materials
58
Transportation
48
Financial
45
Services
40
Capital goods
34
Retail
34
Technology
26
Who Uses Dividend Payout Ratios?
There are two main groups of people who use dividend payout ratios: boards and investors.
How Boards Use Payout Ratio
Boards of directors are in charge of setting policies that determine how much of a company’s earnings are paid to shareholders as dividends. Payout policies are often based on one of the following.
- A fixed dollar amount. This makes sense for mature businesses with a stable income. It provides shareholders with financial stability by making set dividend payments at regular intervals.
- A target payout ratio. This means that the company will distribute a set percentage of its net income for the given period as dividends. This protects the company in periods of poor performance but shareholders must be prepared to receive irregular payments.
- Another measure of performance, such as cash flow, is calculated as an average of multiple years.
The goal is to find a balance between keeping shareholders happy and investing in business growth.
How Investors Use Payout Ratio
Some investors will look at the dividend payout ratio of a particular company (among other metrics) to determine whether it is a worthwhile investment.
A higher dividend payout ratio (especially over multiple years) gives investors confidence that the company is generating enough income to cover its operating costs and still pay dividends. It is an indicator of the potential dividend income the investor could earn as a shareholder.
Investors who are focused on their dividend income may prefer companies with higher dividend payout ratios. They are on the lookout for a dividend payout ratio that is regular and predictable or increases steadily and sustainably over time.
However, a company with a low payout ratio may still be a good investment. Like any financial metric, context is everything when analyzing a dividend payout ratio.
For a young startup or even a mature business that is recovering from a difficult period, a lower payout ratio indicates that income is being pumped back into the business, which may be best for its long-term prospects. These prospects will likely lead to a higher share price, potentially bringing investors much more value than even the highest dividend payouts it could have possibly made.
Likewise, a company with a high dividend payout ratio may be missing out on growth opportunities by spending too much on dividends.
Growth investors, who are focused on the future value of their shares, often prefer companies with low payout ratios.
Investors use dividend payout ratio alongside other metrics like stock price, profitability ratios, and downside risk to assess a company.
Dividend Payout Ratio Example
Imagine there are two mature tech companies who compete in the same sector. Company A has a net income of $100k and pays total dividends of $10k. We can plug this data into the dividend payout ratio formula.
Dividend payout ratio = Dividends paid/Net income = 10/100 = 0.1
Company B has a net income of $40k and pays $8k in dividends. Therefore, we can calculate the dividend payout ratio as follows:
Dividends paid/Net income = 8/40 = 0.2
Therefore, Company A pays 10% of its income as dividends and retains 90% of its income while Company B pays 20% of its income and retains 80%.
At first glance, these are quite low ratios but low ratios are common in tech because of the need to invest in R&D.
Company B appears to be a far better investment because it has a higher payout ratio but this needs to be weighed against the fact that it has a lower net income.
Analysts should do a dividend payout ratio calculation for the previous five years and examine the financial statements of each company to determine the dividend’s sustainability and ascertain which would be the best fit for their investment needs.
Before you make any rash decisions based solely on a company’s dividend payout ratio, remember that you should be concerned with other factors like stability, liquidity, solvency, and more. Tools like the Sortino Ratio and solvency ratios can also help to fill out the picture.
What Is Dividend Yield?
The amount of dividends paid out relative to the share Price is referred to as dividend yield.
Dividend yield is a more commonly used metric than dividend payout ratio. Investors use both metrics to assess the dividend income they could earn as shareholders of a particular company. However, they measure different things.
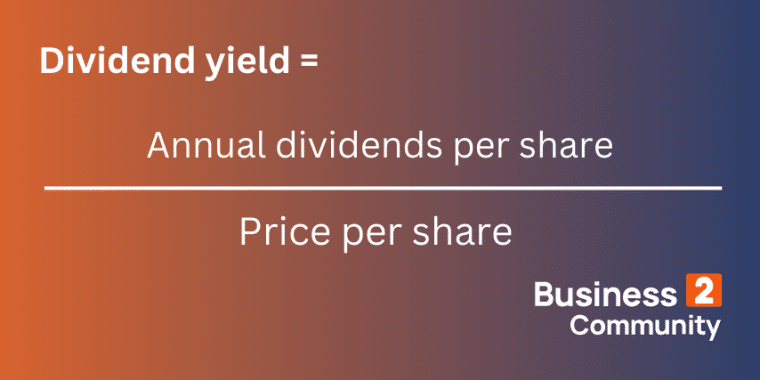
Dividend yield compares the annual dividends earned on a share to the price of that share. It is a simple rate of return that tells shareholders what they have earned for every dollar they’ve invested.
Dividend yield is an essential metric for income-oriented investors but dividend payout ratio is directly linked to net income and therefore considered a better indication of a business’s financial health.
Dividend Yield Example
For example, if company XYZ paid our $5 in annual dividends per share and the stock is trading at $20 per share:
Annual dividends per share/Price per share = 5/20 = 0.25
Dividend yield is usually expressed as a percentage so XYZ’s shares have a yield of 25%.
What happens if the price per share increases to $25?
5/25 = 0.2
If the share price rises, the yield drops because investors need to spend more to get the same returns.
Dividend Sustainability: How Reliable is the Dividend Payout?
A key aspect of dividend investment strategy is understanding dividend sustainability, which can be assessed by analyzing a company’s payout ratio over time.
A sustainable dividend payout ratio typically ranges from 40% to 60%, indicating that the company retains enough earnings for growth while also rewarding shareholders.
Ratios consistently above this range may suggest that dividends are at risk, particularly if earnings decrease.
What Is a Good Dividend Yield?
As with dividend payout ratio, a ‘good’ yield depends on the industry, the company’s growth stage, and market conditions, among other factors.
However, generally speaking, a yield of 2-5% is considered strong. Anything above 5% is seen as risky, although it may generate a high dividend payout.
The overall yield of an index like the S&P 500 (1.37% at the time of writing) or the FT-SE 100 (3.9% at the time of writing) can be a good benchmark.
What Is Retention Ratio?
Retention ratio is the opposite of dividend payout ratio. It measures a company’s retained earnings (i.e. earnings that are not paid out as dividends) as a percentage of total earnings.
The formula for retention ratio is retained earnings divided by net income.
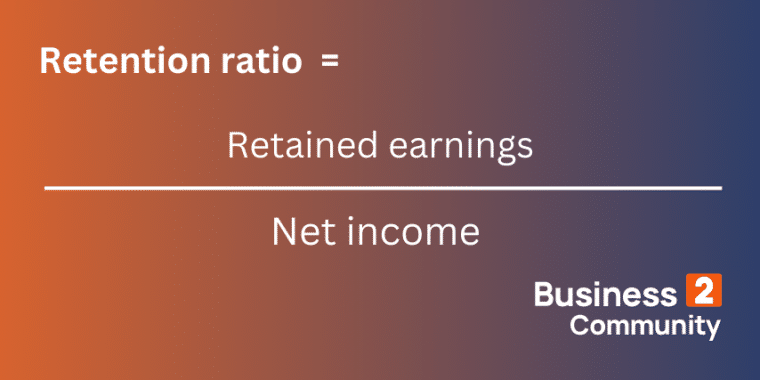
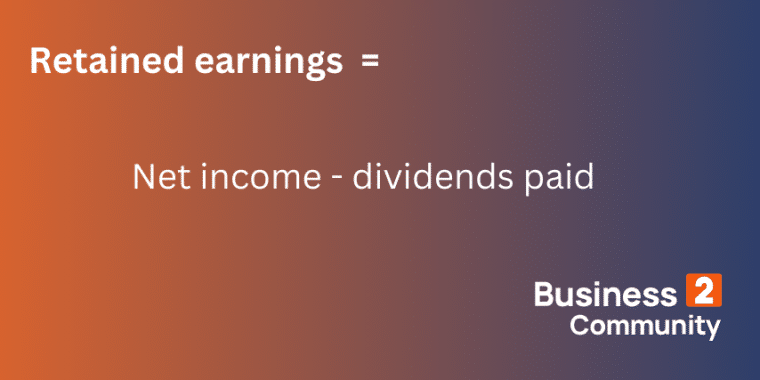
To calculate retained earnings, simply subtract dividends paid from net income.
Keep the Dividend Payout Ratio in Your Toolbox
Whether you’re considering an investment, sizing up competitors, or reflecting on your company’s financial health, dividend payout ratio is a useful metric that reveals a company’s priorities and helps establish a clear relationship with shareholders.
The particulars of a company, such as industry, growth stage, and profitability, should always be considered when assessing dividend payout ratio.
Pro Tip: For investors analyzing dividend-paying stocks, it’s crucial to consider not just the dividend payout ratio, but also the company’s earnings stability, growth potential, and overall market conditions. Diversifying your portfolio to include companies with varying payout ratios can also help manage risk and enhance potential returns.
