The leverage ratio is a group of formulas that shows a business’s financial health. Debt can be helpful for businesses of any size, but too much debt can be dangerous. A leverage ratio helps you understand a company’s debt levels compared to their overall finances. Essentially, it indicates if a business is likely to meet its financial obligations. If you’re a lender, investor, or business owner, it’s an essential tool to have.
What Is a Leverage Ratio?
Leverage is the use of borrowed money to invest in a business. You might leverage debt to develop a new product, buy equipment, or increase your cash flow.
A leverage ratio is a financial measurement of debt. It shows a business’s debt relative to another financial metric, such as:
- equity
- assets
- capital
- operating income
It highlights how much of a business’s capital comes from debt as opposed to other sources.
For some leverage ratio formulae, higher leverage ratios are preferable while for others a lower figure indicates a more stable business.
What Is a Leverage Ratio Used For?
Leverage ratio is used by:
- banks and other lenders to assess whether a business is overly reliant on debt and is therefore likely to default on loans.
- investors to decide if a business is likely to deliver a return on investment.
- businesses when they are raising money or assessing their financial health.
8 Common Leverage Ratios You Need to Know
Leverage ratio is not just one formula but a set of formulae that show debt relative to other metrics on a business’s financial statement. Let’s take a look at some of the most common ratios.
1. Debt to equity ratio
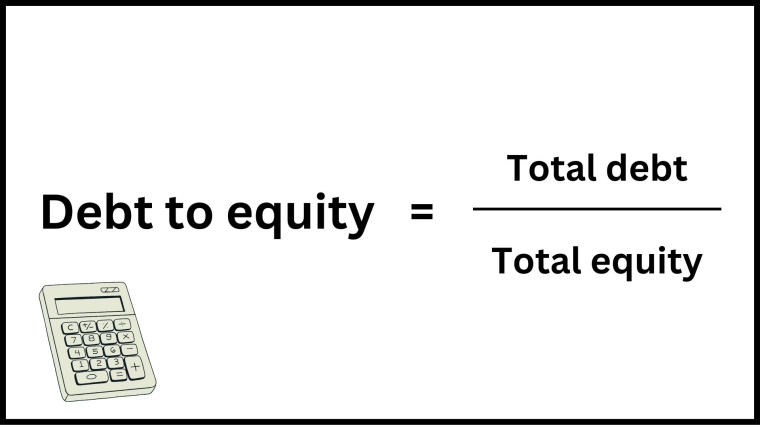
As you may have guessed, the debt to equity ratio compares a company’s debt to its equity. The calculation for this ratio is total debt divided by total equity.
Debt financing vs equity financing
There are two primary ways that companies can raise capital: debt and equity. Put simply, debt is borrowed money whereas equity involves selling a portion of the company in return for capital. Most companies use a combination of both resources.
The advantage of equity is that the business does not have to repay the capital it brings in or any interest, although investors will expect growth and a return on their investment.
The disadvantage of equity financing is that the business owners must give up some control over the business and a portion of the ownership.
Debt, on the other hand, allows a business owner to retain full control and ownership of the business but it must be paid back with interest.
What is a good debt to equity ratio?
A higher ratio means the company relies more heavily on debt to finance its growth. A business with a higher ratio is said to be highly leveraged which could equate to more risk. A lower ratio means the company relies more heavily on equity which can mean it is at less risk.
The ideal number will vary by industry. Generally, a debt to equity ratio of 1 to 1.5 is considered healthy but in capital-intensive industries like manufacturing and finance, many companies will have a ratio above 2.
In some cases a very low debt to equity ratio could indicate to investors that you are under-utilizing debt and missing out on safe growth opportunities.
2. Debt to assets ratio
When a company wants to purchase assets, like equipment or property, it can do so using cash generated by the business, or by raising capital through debt or equity.
The debt to assets ratio tells us how much of a company’s assets have been purchased using debt. In other words, it shows how much of the company’s assets are owned by its creditors.
This is a good indication of whether a company will be able to service its debt and borrow money going forward.
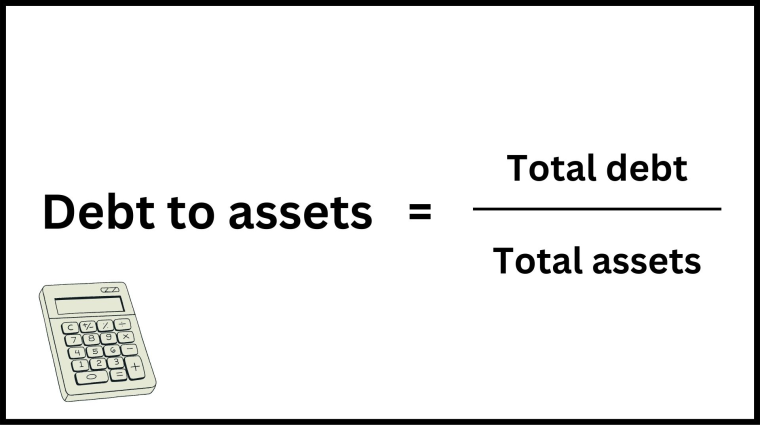
The calculation for this financial leverage ratio is total debt divided by total assets.
What is a good debt to asset ratio?
A lower debt to asset ratio is preferable. A company with a debt to asset ratio:
- well below 1 is considered healthy.
- close to 1 is highly leveraged and potentially at risk.
- above 1 has taken on more debt than the value of its assets and is at high risk.
3. Debt to capital ratio
The debt to capital ratio compares a company’s debt to all of the capital it has raised, including both debt and equity. This creates a picture of how the business is financing its operations.
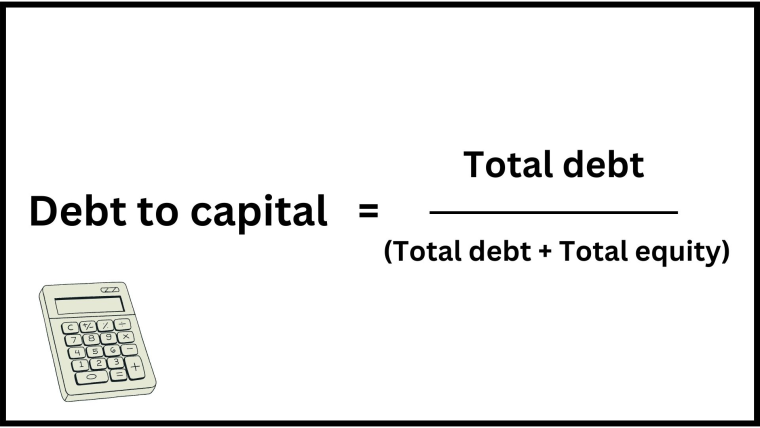
The calculation for this metric is total debt divided by the sum of a business’s total debt and equity.
What is a good debt to capital ratio?
Generally a business with a higher debt to capital ratio is seen as a riskier investment. As with most financial leverage ratios, there is no magic number but a ratio under 0.5 is considered favorable.
4. Debt to EBITDA ratio
This is the first ratio in the list that takes into account not just how a business is financed but also its financial performance. The debt to EBITDA ratio shows a company’s ability to pay off its debt based on its current financial performance and debt levels.
EBITDA is a metric that reflects a company’s operating performance and is an indication of cash flow. It stands for earnings before interest, taxes, depreciation, and amortization.
There are two ways to calculate EBITDA.
- Operating profit + depreciation and amortization.
- Net profit + interest, tax, depreciation, and amortization.
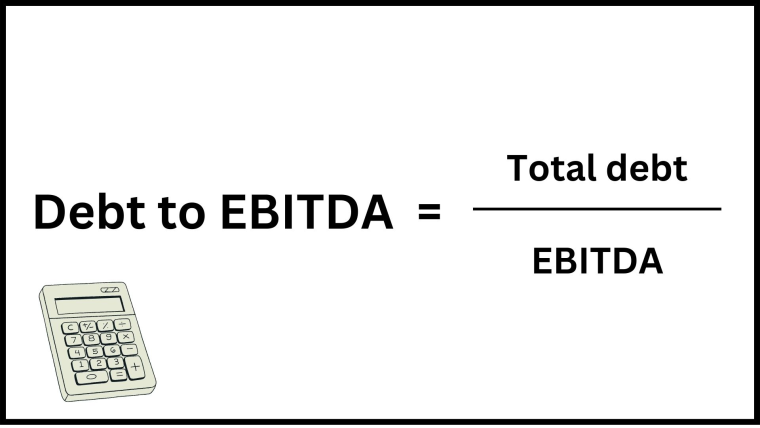
The calculation for debt to EBITDA ratio is a company’s total debt divided by EBITDA.
What is a good debt to EBITDA ratio?
A lower debt to EBITDA ratio indicates a higher probability that a business will be able to pay off its debt. According to the Corporate Finance Institute, in general, a ratio of:
- Less than 3 is considered acceptable.
- 3 or 4 is considered high risk.
5. Operating leverage ratio
Operating leverage ratio shows how much a business’s income changes when sales go up or down. It is also known as a degree of operating leverage or DOL.
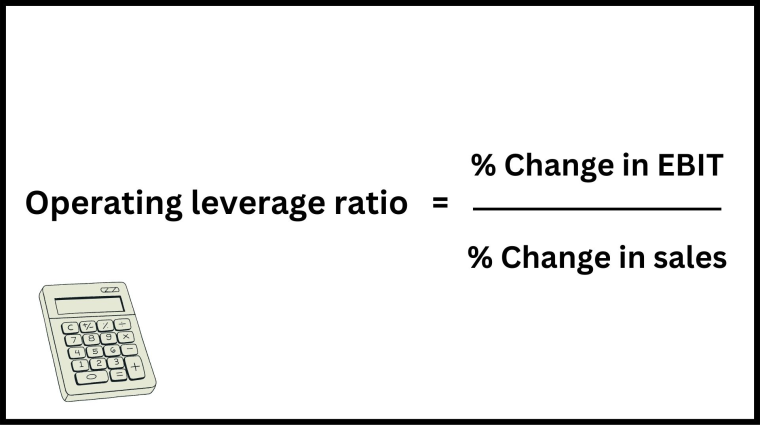
This metric is calculated by dividing a business’s percentage change in EBIT by its percentage change in sales.
EBIT stands for earnings before interest and tax. It is a measure of profitability. EBIT is also known as operating income. It is calculated in two ways:
- EBIT = Net income + Interest + Taxes
- EBIT = Gross profit – Operating expenses
Fixed costs vs variable costs
Operating leverage ratio is an indication of a business’s fixed costs relative to variable costs.
Fixed costs are costs that stay the same regardless of how much a business produces and sells. This includes things like rent and insurance.
A business with more fixed costs has a higher operating leverage. The more units they sell, the lower the cost per unit because the fixed costs are spread across more units. This creates the potential for greater profitability at scale.
Variable costs, conversely, are directly related to a business’s sales. Examples include shipping fees and sales commissions.
A business with more variable costs has low operating leverage. The cost per unit does not change much as your sales increase because your variable costs will increase at the same pace. This limits your profitability as you scale.
What is a good debt to operating leverage ratio?
A higher operating leverage ratio is desirable because it means a business can earn larger profits as it scales. However, in periods when sales are poor, it may be difficult for the business to cover their fixed costs.
A business with a lower operating leverage will be better able to survive economic downturns because its costs will reduce with its sales.
Some industries tend to have higher fixed costs than others so it makes sense to look compare your operating leverage to company’s in the same industry. In general, an operating leverage ratio of:
- Less than 1 is too low. As your sales increase, your income profitability is dropping.
- 1 is fairly low. Your profit is increasing in direct proportion to your sales.
- Above 1 is preferable. Your profits are increasing at a greater rate than your sales.
6. Net leverage ratio
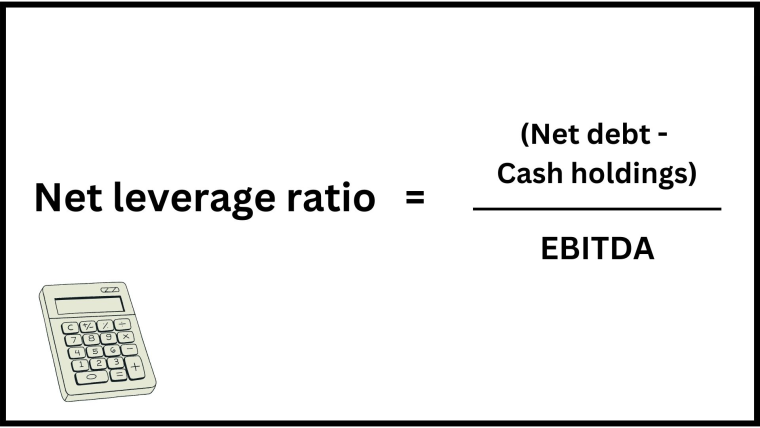
Like the debt to EBITDA ratio, the net leverage ratio measure’s a business’s ability to pay off its debt based on its current financial performance and debt levels. However, it includes an additional variable: cash holdings. This makes sense because a business could potentially use its cash holdings to pay off debt.
To calculate net leverage ratio, subtract cash holdings from net debt and divide by EBITDA.
7. Interest coverage ratio
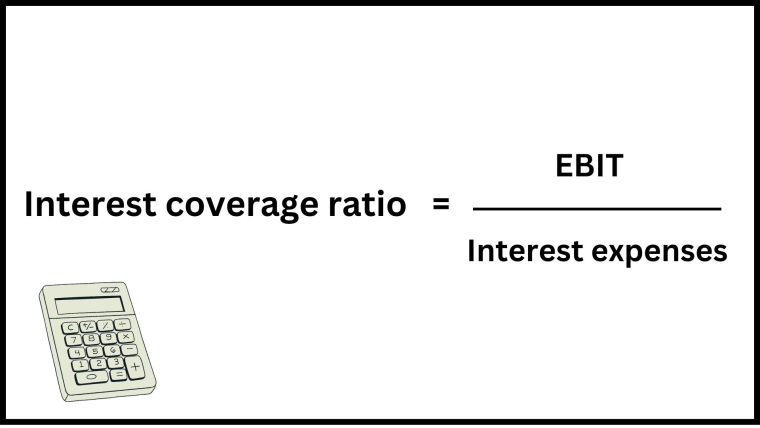
Interest coverage ratio indicates a company’s ability to repay interest on borrowed money based on its cash flow. It compares what a company is earning to what it owes in interest payments. It is calculated by dividing operating income (EBIT) by interest expenses. This is a measure of short-term financial health.
A higher interest coverage ratio is preferable because it means a business is more likely to be able to pay off interest on its debt when it is due. An interest coverage ratio of 2.5, for example, means a company could cover its interest payments 2.5 times with its available cash flow.
In most industries, an interest coverage ratio of:
- 2 is the minimum acceptable figure.
- Less than 1 is a red flag.
8. Fixed charge coverage ratio
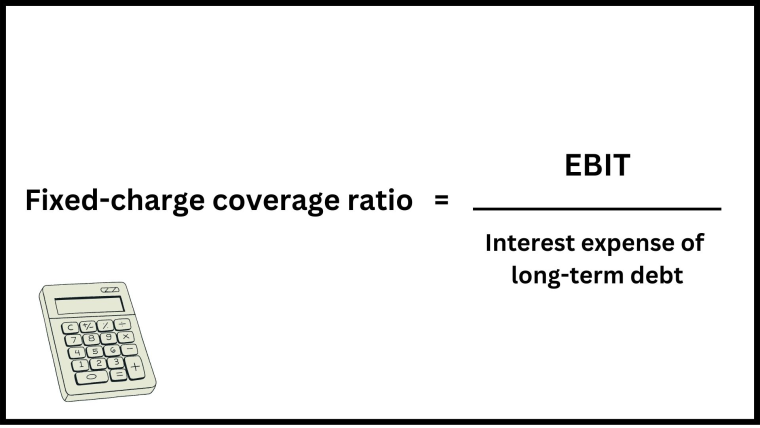
The fixed charge coverage ratio demonstrates how easily a company can pay off fixed charges such as mortgage or loan payments. It tells us how many times over a company can pay its predictable monthly costs using its available cash flow.
The calculation for this ratio is EBIT divided by the interest expense of long-term debt.
As with the interest coverage ratio, a low figure indicates risk because it suggests that a company is less likely to be able to cover its fixed charges.
How to Calculate a Leverage Ratio
To calculate a financial leverage ratio, use one of the formulae above and plug in the required numbers. Let’s calculate some common leverage ratios for an imaginary business.
Ice Cream Sandwiches LLC reports the following figures in its latest financial report:
- Total debt: $60 billion
- Total assets: $100 billion
- Total equity: $30 billion
- EBITDA: $10 billion
Let’s apply these variables to some financial leverage ratio formulae.
- Debt to equity ratio = total debt/total equity = 60 billion/30 billion = 2
- Debt to assets ratio = total debt/total assets = 60 billion/100 billion = 0.6
- Debt to capital ratio = total debt/(total debt + total equity) = 60 billion/(60 billion + 30 billion) = 0.666
- Debt to operating profit = total debt/EBITDA = 60 billion/10 billion = 6
Are Leverage Ratios Important?
Debt is a valuable tool that can help businesses grow but it can also spell doom for businesses who are unable to meet their financial obligations. So how much debt is too much debt? After all, debt that would cripple one business could be manageable for another, and industries like mining and manufacturing require higher levels of debt and equity than other industries.
No single leverage ratio will answer this question definitively, but business operators, lenders, and investors can use multiple leverage ratios in combination with other financial metrics to assess the financial health of a business and analyze its debt levels.
In short, leverage ratios can:
- help investors make wise investments.
- help lenders avoid issuing debt to risky borrowers.
- help businesses demonstrate their financial health to potential investors.
- help businesses avoid becoming over-leveraged or being overly conservative with debt.
Examples of Leverage Ratios
Here are some examples of financial leverage ratios from the real world.
1. Tesla
Back in 2018, Tesla was $12 billion in debt and investors were worried that it was over-leveraged. At the time, its debt to equity ratio was around 2.16. It is now 0.069, meaning the company is in a far better position in terms of the company’s financial leverage.
Over the past 5 years, Tesla has scaled up its productions, sales have boomed, and it has been able to pay down billions to become almost debt free.
Auto manufacturers typically have a lot of debt because it is a capital-intensive industry but Tesla fares well when compared with competitors. Here are some examples of other auto manufacturer debt to equity ratios:
2. Zoom
Zoom enjoyed a boom in sales during the pandemic when many of us relied on video calls for communication. Post-pandemic, demand has dropped. These changes in its financial performance are visible in this graph showing its EBITDA for the past 5 years.
Zoom has maintained zero debt throughout this period which means that the company’s financial leverage is healthy. Both its debt to EBITDA ratio and debt to equity ratio are also zero. They are therefore at no risk of a debt crisis and all their capital is coming from shareholder equity.
Putting It All Together
Financial statements provide a long list of metrics but its not always clear how those metrics relate to one another. Leverage ratios put two or more metrics together so we have a way to understand their combined impact. Leave the details to your accountant if you like, but a basic understanding of leverage ratios will go a long way to mitigate risk in your business operations or investments.
