What Is a Solvency Ratio?
Solvency is a company’s ability to meet its long-term financial obligations. It is a measure of sustainable financial stability.
Solvency ratios are a group of financial metrics that compare different variables to help determine a company’s risk of insolvency.
Unfavorable ratios indicate potential solvency issues during hardships, while favorable ratios facilitate access to financing, like loans and investments.
Solvency ratios fall under a larger category of metrics called leverage ratios.
Financial leverage is the use of borrowed money to invest in a business (e.g. taking out a loan to develop a new product). Leverage ratios compare a business’s debt to its capital from other sources so that you can make sure that doesn’t happen.
Recommendation: Already know enough on the topic and just want to get to our solvency ratio calculators? Just scroll down and get to calculating.
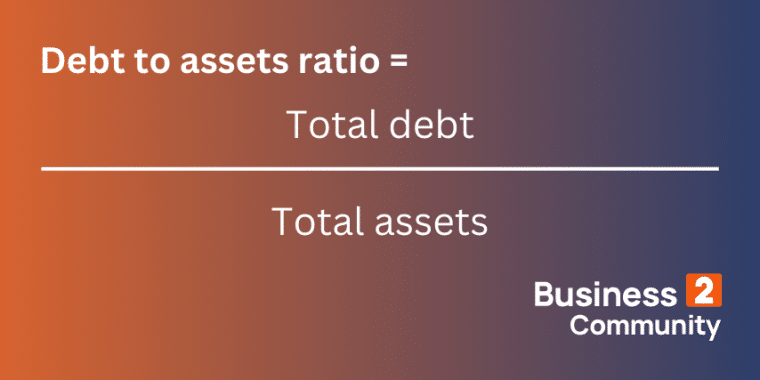
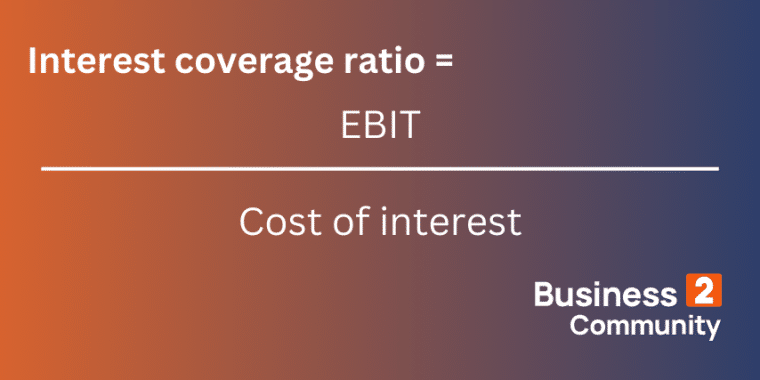
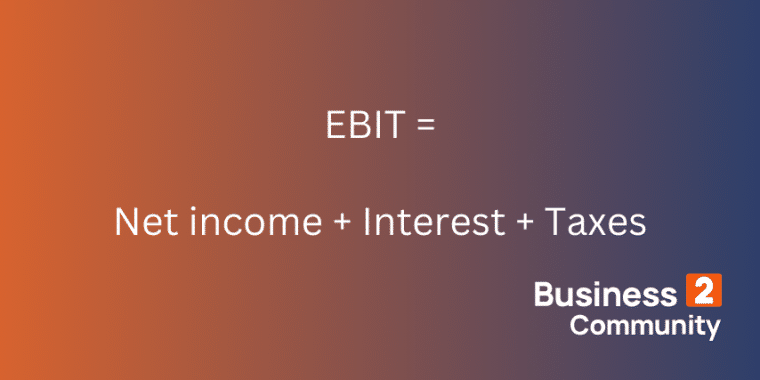
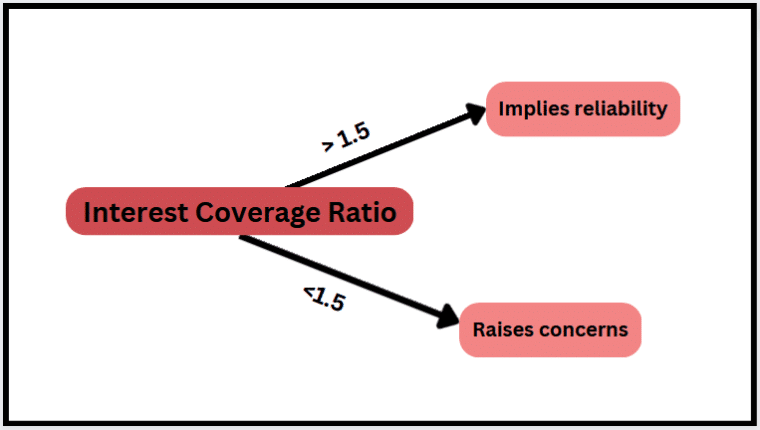
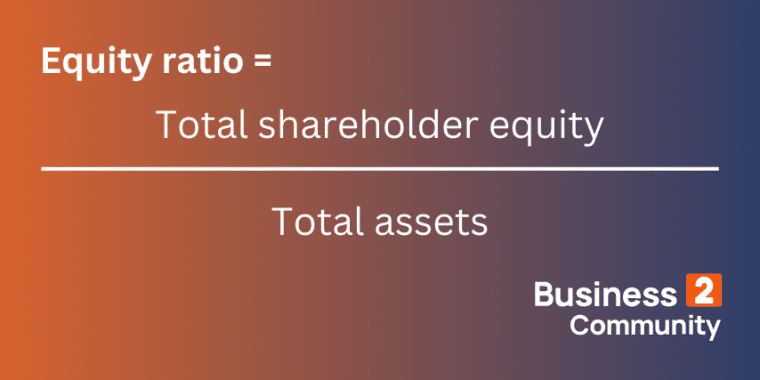
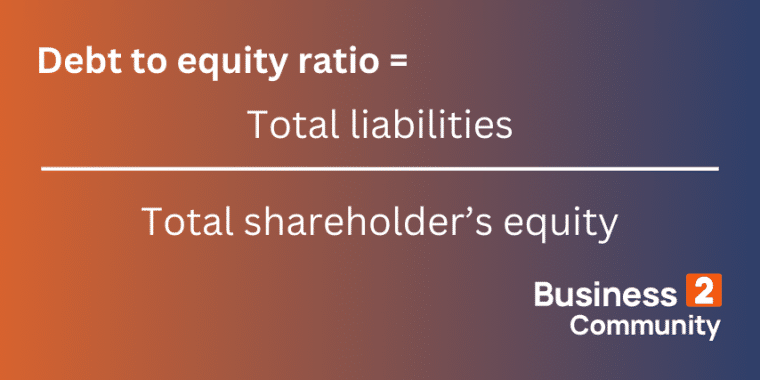
Key Takeaways: Solvency ratios are used by: There are 4 main solvency ratios: Let’s take a look at each of them, their formulae, and what they reveal about a business. When a company wants to purchase assets, like equipment or property, it can do so using cash generated by the business, or by raising capital through debt or equity. The debt to assets solvency ratio tells us how much of a company’s assets have been purchased using debt. It reveals how much of the company’s assets are owned by its creditors. It is an indication of whether a company will be able to service its debt obligations for the foreseeable future. The formula for the debt to assets ratio is simply total debt divided by total assets. A company with a debt to assets ratio: For the year to 31 Dec 2022, the Dulce & Banana Wafflehouse has total debt of $60k and total assets of $120k. Let’s plug those figures into the solvency ratio formula. Debt to asset ratio = total debt divided by total assets = 60/120 = 0.5 Therefore, 50% of the company’s assets were purchased using debt. Dulce & Banana has a healthy ratio of debt to assets and is likely to meet its long-term debt obligations while remaining profitable. Interest coverage ratio (ICR) is a financial ratio of debt to profitability. It indicates how easily a company can afford the interest it owes on outstanding debt. More specifically, this solvency ratio measures how many times over the company can pay its interest payments using its current earnings. The standard ICR formula is EBIT divided by the cost of interest. Variations on this solvency ratio formula use EBITDA (earnings before interest, taxes, depreciation, and amortization) or EBIAT (earnings before interest after taxes) instead of EBIT as a measure of profitability. EBIT stands for earnings before interest and tax. It is a measure of profitability and can be calculated in two ways: The cost of interest, also known as interest expense, refers to the cost of borrowing money. It includes all interest payments owed by a company over a given period. When assessing a company’s ICR, the easiest approach is to take the company’s total debt and multiply it by the average interest rate on its debts. For example, if the business has several loans totaling $10k at an average interest rate of 5%, the calculation for cost of interest is 10,000 x 0.05, which means their total cost of interest is $500. A higher ratio ICR is usually better because it indicates that a company has no trouble paying interest on its debt obligations without eating up too much of its operating budget. This is a positive indication of a company’s long-term health. The definition of a ‘good’ or ‘bad’ ICR varies by business and industry. For example, a small company with no cash reserves may need a higher ICR than a utilities company with lots of saved capital and government subsidies. In general, an ICR of: For Q4 of 2023, Tom’s Tours travel agency has an EBIT of $150k and a cost of interest of $50k. We can use these figures to calculate the solvency ratio. ICR = EBIT/Interest expense = 150/50 = 3 This is higher than 1.5 which suggests that Tom’s Tours is not at any risk of defaulting on its interest obligations. If it turns out that agencies of a similar size in the same industry have an average ICR of 2.8 for the same period, then Tom’s Tours is in a healthy position relative to its competitors. Equity ratio (also known as equity to asset ratio) compares shareholder equity to assets. Shareholder equity is a company’s net worth. It is the value owed to shareholders after all debts are paid if the business is liquidated. Total assets can be calculated by adding shareholder equity to total liabilities. This solvency ratio assesses how much of a company’s assets are owned by investors rather than lenders. In other words, it asks, “If this business goes bankrupt, how much of its asset value would go to shareholders rather than towards covering the company’s liabilities?” The equity ratio is also an indication of whether investors’ valuation of a business matches its asset value. If a company’s equity is far greater than its assets, the business may be overvalued by investors. For this solvency ratio, a higher number is preferred by investors and prospective business lenders. A lower ratio means a business is more leveraged (i.e. relies more on borrowed money) and is at higher risk of insolvency. A figure of: Hadbury’s Chocolate Company has total assets of $100k and total equity of $44k. Using the solvency ratio formula above: Equity ratio = 44/100 = 0.44 Therefore, Hadbury’s has leveraged its debts and holds more liabilities than equity. The Gershey Chocolate Company, meanwhile, has $80k in assets and total shareholder equity of $120k. Therefore: Equity ratio = 120/80 = 1.5 We can see from these solvency ratios that Gershey’s has a greater proportion of equity to liabilities than Hadbury’s. That may be a red flag for Hadbury’s. The debt to equity ratio simply compares a company’s debt and equity by dividing total liabilities by total shareholder’s equity. There are two primary ways that companies can raise capital: debt and equity. Most companies use a combination of both resources. The advantage of equity is that the business does not have to repay the capital it brings in or any interest, although investors will expect growth and a return on their investment. The disadvantage of equity financing is that the business owners must give up some control over the business and a portion of the ownership. Debt, on the other hand, allows a business owner to retain full control and ownership of the business but it must be paid back with interest. A higher debt to equity ratio means a company relies more heavily on debt to finance its growth. A business with a higher ratio is said to be highly leveraged which could equate to more risk. A lower ratio means the company relies more heavily on equity which can mean it is at less risk. Generally, a debt to equity ratio of 1 to 1.5 is considered healthy but in capital-intensive industries like manufacturing and finance, many companies will have a ratio above 2. In some cases, a very low debt to equity ratio could indicate to investors that you are under-utilizing debt and missing out on safe growth opportunities. Imagine that Spark, an electric car hire company, has debt of $13m and equity of $4m. Debt to equity ratio = debt/equity = 13/4 = 3.25 This indicates that Spark relies heavily on financing from lenders. While the car hire industry is capital-intensive, a comprehensive evaluation of Spark’s financial risk would involve comparing its debt to equity ratio with those of other electric car hire companies. It’s finally time to get calculating. All you need to do is make sure that your data is up-to-date and accurate. Then, plug your data into the fields in each solvency ratio calculator below and hit calculate. If solvency ratios are a full medical then liquidity ratios are vital signs. These closely related groups of financial ratios measure different aspects of a company’s financial health. Solvency is a company’s ability to meet its financial obligations over the long-term. Liquidity, meanwhile, is how quickly a business can turn assets into cash in order to meet its short-term debt obligations. Common liquidity ratios include current, quick, and cash ratios. Yes, a high solvency ratio is generally considered good because it indicates that a company has a strong financial position and is better equipped to meet its long-term financial obligations. A high solvency ratio suggests that the company has a lower risk of insolvency or bankruptcy. However, excessively high ratios may indicate underutilization of debt or inefficient capital structure. No, solvency and debt are not the same. Solvency refers to a company’s ability to meet its long-term financial obligations using its assets and cash flow. It’s a broader measure of financial health and stability. On the other hand, debt is a specific component of a company’s financial structure, representing the amount of money borrowed from external sources such as banks, bondholders, or other creditors. While solvency ratios may include measures of debt, they also consider other factors like equity and profitability. A company’s balance sheet is full of valuable information but it is also convoluted and difficult to compare. Solvency ratios are clean, simple metrics that can distill essential information about the relationship between different variables, making it easy to compare businesses to their competitors and monitor worrying trends. Most businesses like to compute these ratios on a regular basis to make sure that their financials are on track and you should too.
Why Are Solvency Ratios Useful?
The 4 Common Solvency Ratios
1. Debt to Assets Ratio
What is a good debt to assets ratio?
Debt to assets ratio example
2. Interest Coverage Ratio
How to calculate interest coverage ratio
What is EBIT?
What is the cost of interest?
What is a good interest coverage ratio?
Interest coverage ratio example
3. Equity Ratio
What is a good equity ratio?
Equity ratio example
4. Debt to Equity Ratio
Debt financing vs equity financing
What is a good debt to equity ratio?
Debt to equity ratio example
Solvency Ratio Calculators:
Interest Coverage Ratio
Debt to Assets Ratio Calculator
Earnings Before Interest and Tax (EBIT) Calculator
Equity Ratio Calculator
Debt to Equity Ratio Calculator
Solvency Ratios vs Liquidity Ratios?
Liquidity ratios
Solvency ratios
Helps with questions like
How fast can current assets be converted into cash? Will we be able to pay our bills next year?
Can long-term debt be covered without hassle? Should I make a long term investment in this business?
Outlook
Short-term
Long-term
Asset type
Liquid assets e.g. cash
All assets
Common ratios
Current, quick, and cash ratios
Debt-to-equity, interest coverage, debt-to-asset, and equity ratios
Analysis
Higher ratios are better
Lower debt to asset and debt to equity ratios are better. Higher interest coverage and equity ratios are better,
Tips for Analyzing Solvency Ratios
Is a High Solvency Ratio Actually Good?
Is Solvency the Same as Debt?
Final Thoughts: Don’t Underestimate the Power of Solvency Ratios
