I spend the first week of every month submerged in cesspool of data. Riding the slippery slope between insight and insanity. Looking back at the numbers for all of our clients, sifting through what’s important and what’s interesting. When I finally surface from the deep end I literally say to myself (every month) “Aint nobody got time for that.” That’s usually followed by getting back on track with my regular duties and forgetting to set time aside for streamlining future monthly reporting.
So now it’s that time again and I just so happened to take a look at streamlining my reporting process last week so that I don’t have to lock myself away anymore (even if the office appreciate the peace and quiet while I’m gone). I generally use a mixture of tools and techniques for gather data to include in my report, but Google Analytics is a staple in my data collection process. As of last week, I took my relationship with Analytics to the next level, and like all relationships, it takes a little TLC to be successful. Listed below are the best ways to get started making Analytics work for you.
Establish Goals
Whether you work at an agency reporting for several clients, or at an individual company reporting directly to your stake-holders, setting goals and benchmarks are as important to your success as the first impression on a first date. Go through each client and decide which metrics are most relevant to your success and which metrics will hold the most insight on a monthly basis.
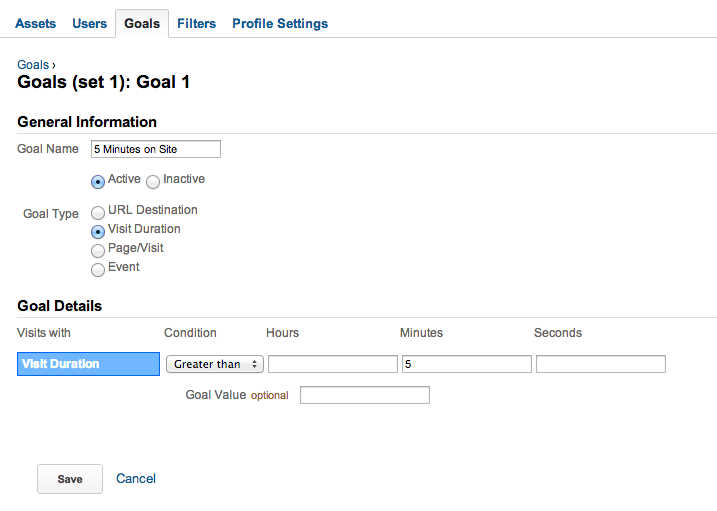
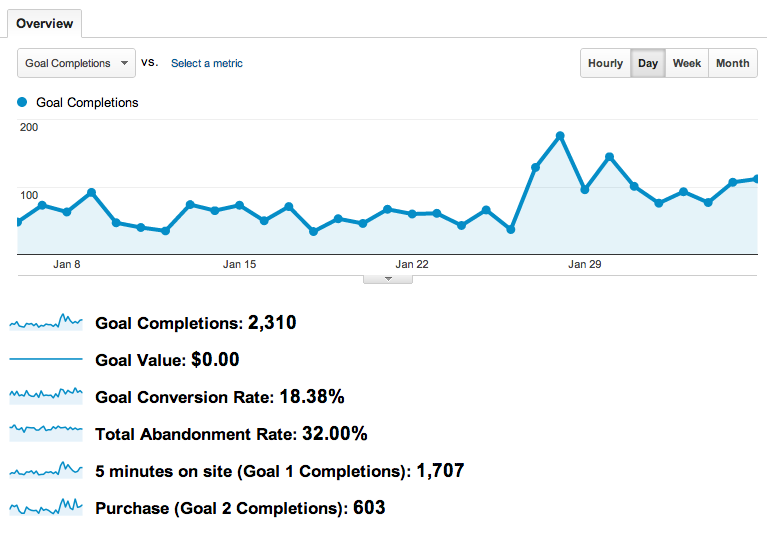
Take your goal setting in analytics a step further by setting up custom goals in your account via the administration tab. This can be particularly helpful for clients looking to measure success without solid data such as sales to work from. Tracking how many people click a link, watch a video, or fill out a form can be incredibly insightful.
Customize Analytics
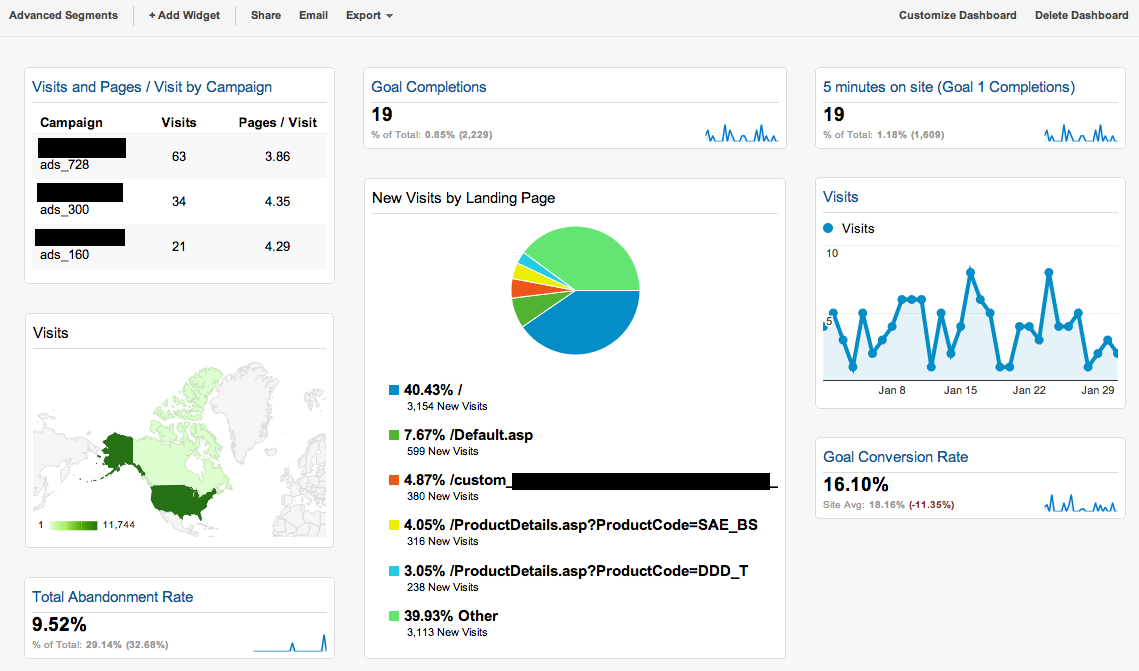
Once you’ve laid out your goals and metrics you want to monitor, you move on to the second date where you really start to know Analytics and you get that warm fuzzy feeling that things are really going to be great. This is where you set up custom dashboards.
Implement your goals and metrics into the easy to view dashboard in Analytics. You can even create several dashboards to help organize what metrics you’re viewing – I just created a few based on organic vs. paid search traffic. You can even set up advanced segments to help filter information to view specific data such as a specific set of keywords, goals, or traffic types. Adding values to your goals can help you really visualize the benefit of each metric you set up.
Implement Widgets
Create pie charts, tables, line/bar graphs, etc to customize how you view your selected metrics. Besides providing custom visuals, the main benefit of widget is the filtering option – you can select your data to filter based on any number of things including: organic vs. paid traffic, traffic medium, source, and all the way down to keyword if that’s what you’re looking for. Widgets are also available as charts or comparative line graphs that represent your metrics over time- so you can compare your data from month to month.
Customizing your Analytics account helps simplify the reporting process but more importantly, it opens the window to insightful traffic analysis. Keep in mind it’s up to you to do the actual analyzing and finding key areas of opportunity. There’s a lot of data to look through, so Analytics can really help you focus on what you think might be important. For more information on reporting, Google Analytics, or other marketing related questions contact us today at www.Londes.com or call 585-617-3242.


