In part one of our series we detailed a new and relative novel approach to intent data, behavioral segmentation (read part-1 for greater detail on user behavior segmentation). However, that user-level analysis is not actionable for most marketers because it is too granular; it does not include any company information.
For actionable application, we need to tie these users back to their employer without losing any of the characteristics or insights that we derived from their behavior. We need to be able to map all activity back to a user’s respective company, regardless if they viewed articles from different IP addresses and/or different locations (in the office, at home, at a coffee shop, etc.).
Aberdeen is the only company that can do this because of the way we gather our user intent data.
Building a Company Profile
For marketers, there are five simple questions (the 5 basic W’s) our intent data can answer:
- Who (what companies) should you be targeting for outreach?
- Why should you target them?
- What type of messaging should you target them with?
- Where (what locations) should you be targeting?
- When you should be reaching out?
For the purpose of this example, we will skip questions 4 and 5 in this series. Make no mistake — Aberdeen can provide detailed location data (which sites or offices should be targeted) and time-series data (what time of year best aligns with each message) to further inform your marketing strategies.
The Who
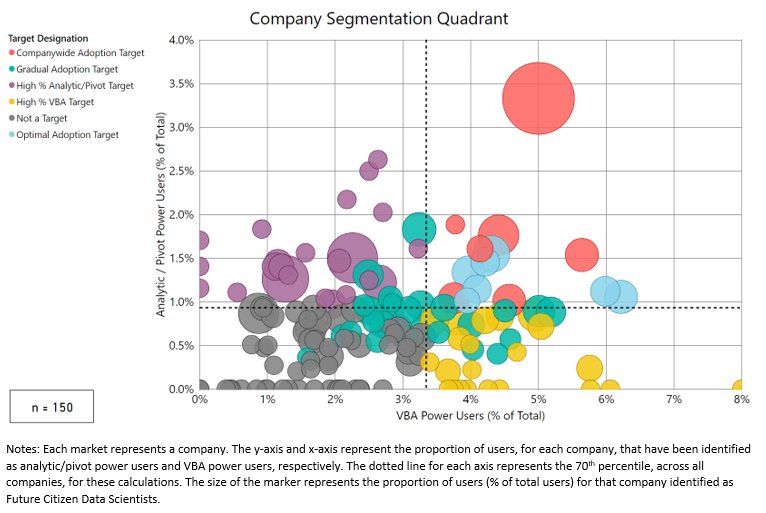
We chose a representative sample of 150 well-known companies that range in size (number of employees, revenue, etc.) — identifying a total of 122,715 users — and traced all their activities and behavioral characteristics accordingly (total number of power users, percentage of users identified as power users, etc.). This form of aggregation enabled us to create company profiles and make comparisons between them, determining the optimal candidates for targeting. The results can be seen in Figure 1 below.
Figure 1
We now have 6 neat (5 important) company classifications. Which segment or combination of segments you target depends on your product and your objectives as a marketer — for example:
- Company-wide adoption of my product
- Smaller, account level adoption of my product
- Small set of enterprise level target accounts
If you were to engage with Aberdeen in a more consultative manner, the differentiating features of your product would also play a major role in the determination of which segments to target (we would also map more than 150 companies). For the sake of brevity, I will examine only 3.
The Why
1.Company-wide Adoption Targets (Red)
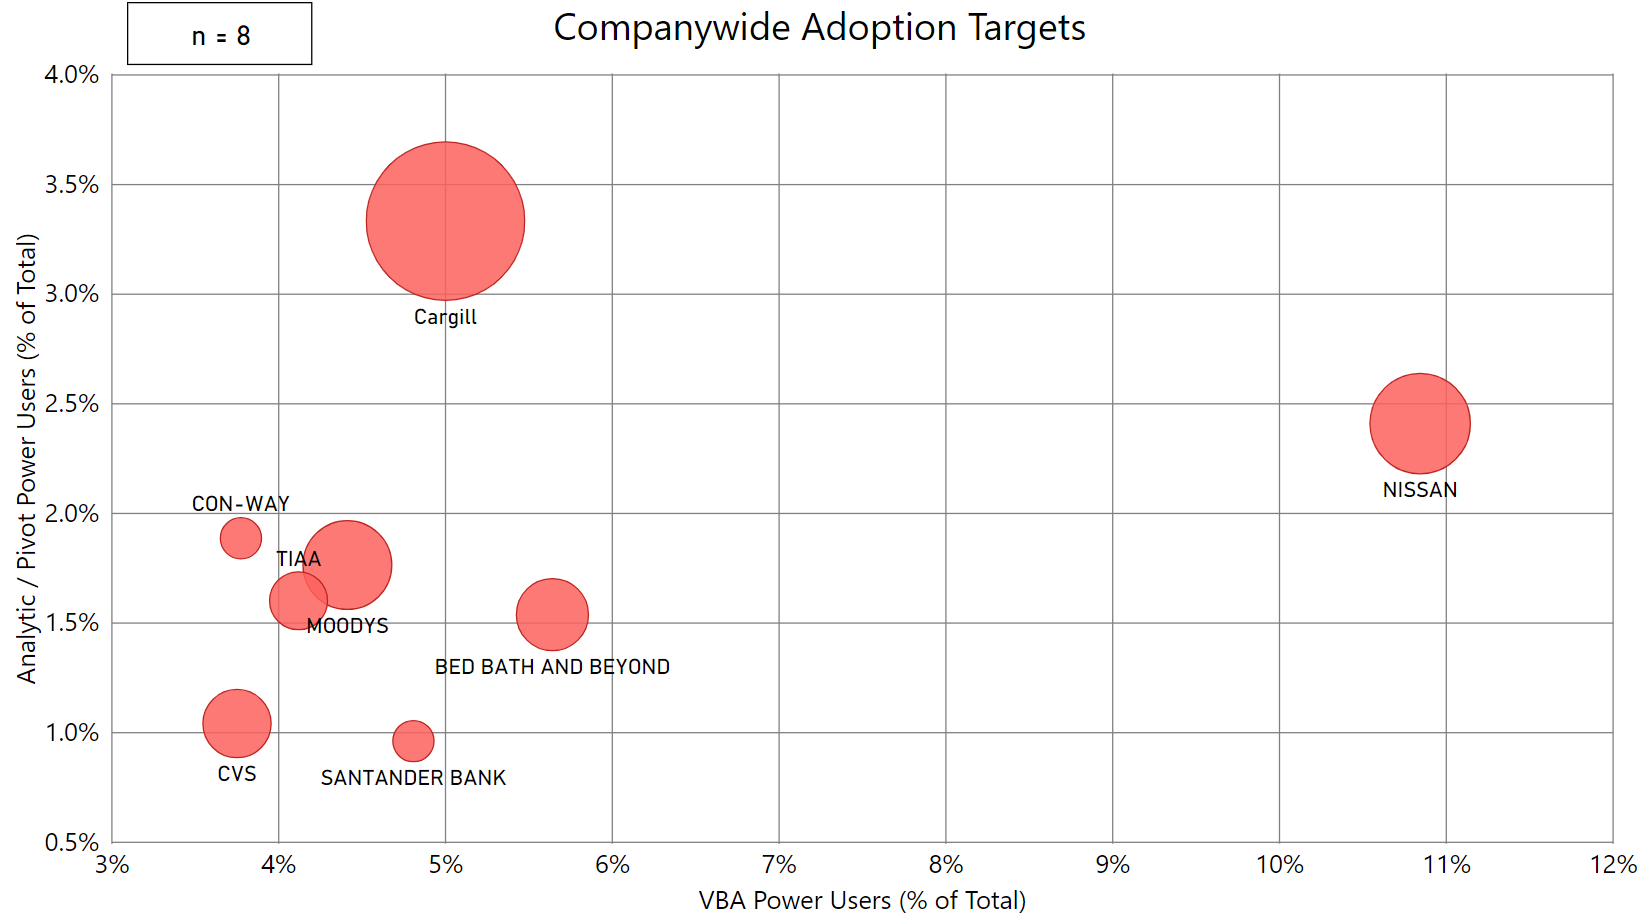
This group of 7 companies (1,760 total users) are the top candidates for company-wide adoption (aptly named) of a Business Intelligence solution (Figure 2). These companies have the highest proportion of both types of power users (above the 70th percentile of all companies), but their total pool of excel users is relatively small. The power users at these companies should have greater influence with the ultimate decision makers.
In other words, these companies have a lot of big fish in a small pond. Their voices are loud and clear and the problems, issues and complaints they convey to decision makers will be heard. Offer these power users a taste of a more robust, versatile solution through a free trial — the probability that the entire company adopts your product increase drastically if they were to complete actual work assignments using your solution.
Figure 2
2. Gradual Adoption Targets (Green)
The 27 companies (77,796 total users) in this segment represent a very different strategy than the previous. These companies represent the behemoths in the sample; they have the highest total counts of power users (above the 70th percentile for all companies). However, these power users are dwarfed relative to the total number of excel users. A company-wide adoption strategy for this segment is simply not a reasonable expectation given their size. Rather, the goal is gradual adoption across groups, business units, and departments.
3. Optimal Adoption Targets (Blue)
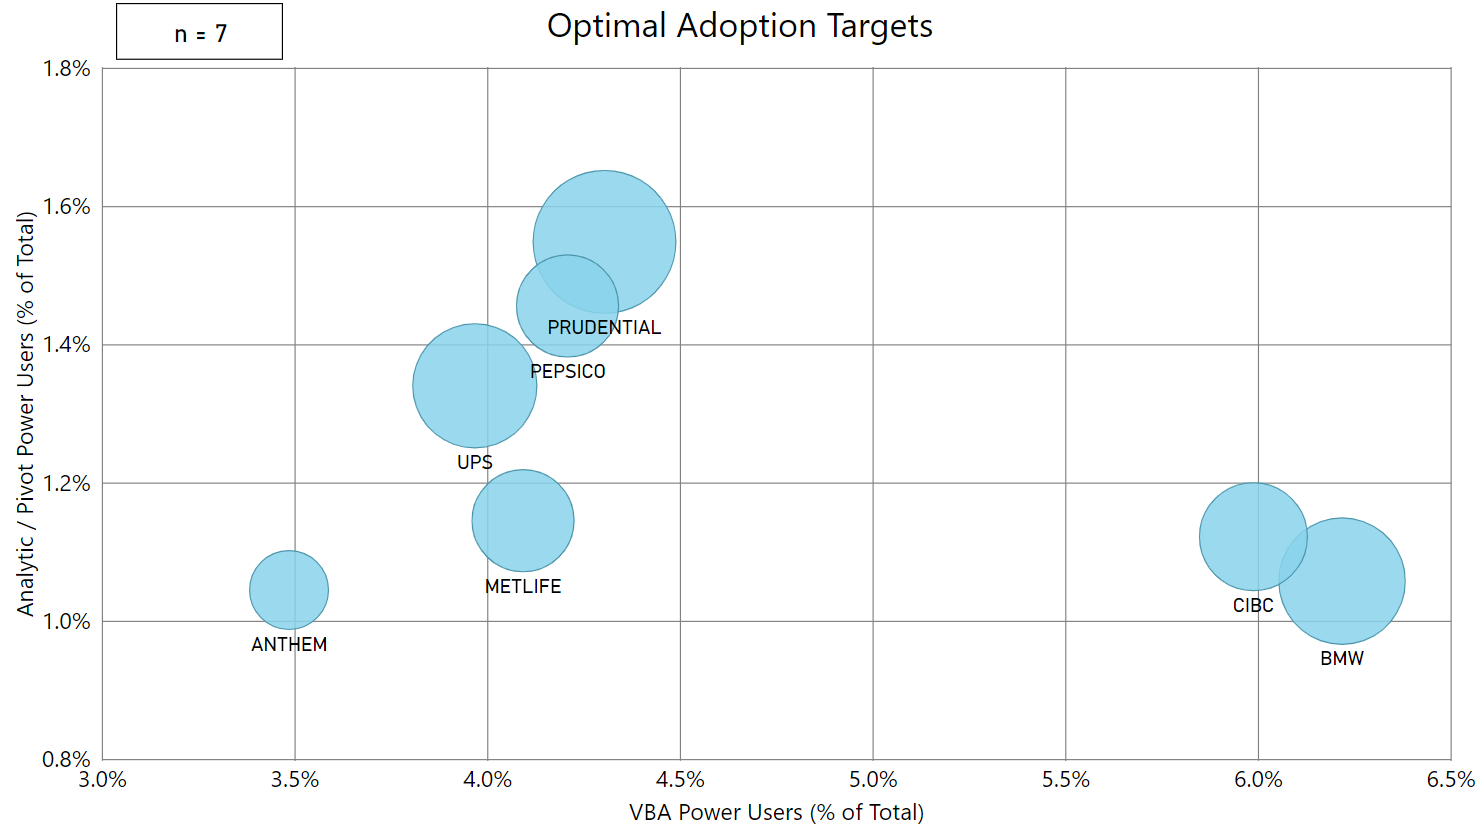
This gang of 7 companies (6,311 total users) are in the Goldilocks zone (Figure 3). They have the highest proportion of both types of power users (above the 70th percentile of all companies) as well as a relatively large pool of basic excel users. This means that both of the previous adoption strategies (company-wide and gradual) are in play.
Figure 3
The What
The true beauty of behavioral segmentation lay in the extensive range of its applications. It can segment the market to maximize your marketing efforts but, equally important, it can help you to craft a unique message for each company and each account at that company. The number of and proportion of power users at each company helps to determine the optimal message (refer to part 1 for messaging strategies derived for each user designation). The identified company classifications only further inform this message:
- Company-wide Adoption Targets (Red) – Content should include messaging about the ease of adoption across the entire organization.
- Gradual Adoption Targets (Green) – Content focused on scalability across groups, the ability to integrate multiple, dissimilar data sources and ease of collaboration.
- Optimal Adoption Targets (Blue) – Content focused on collaboration, integration of distinct data sources and the ability to quickly scale by adding additional users and groups.
In the next part of this series I’ll expand upon this analysis and examine the industries of these 150 companies. In doing so, we will further tailor our messaging strategy for this sample, but also create a strategy that can be applied industry-wide.


