Data is the secret ingredient to an online sellers’ sustained success.
Every business has access to data—but it’s what you do with it that sets you aside from the rest.
The data from customer experience, in particular, has come to the fore of every business in recent years. It acts as the foundation of customer success and loyalty because it can transform the service you offer.
But the question is, which metrics will extract the most valuable data for your support team?
Rethinking customer support metrics
Firstly, customer support metrics are not a one-size-fits-all framework. Every company has different goals and that makes it near impossible to create one generic template. However, every customer support team should be able to distinguish the difference between vanity metrics and actionable ones.
Vanity metrics are there to showcase to the public and put your company “in the limelight.” But it’s the actionable metrics that trigger important questions that impact the bottom line. They should provoke questions about redesigning business goals and filling gaps in the company.
Let’s take a look at the four metrics our customer support team swear by.
Volume of tickets
The phrase “less is more” is a double-edged sword in customer support. In one sense, more support tickets means more customers, which could mean more growth. On the other hand, the less support tickets you receive over time shows that perhaps your team is making massive improvements to your product and systems, thus there are less queries.
At an early stage of a company, support tickets are an essential part of understanding issues with the product. As time goes on, you expect improvements to reduce this volume. Unfortunately, that’s not always the case. At xSellco, our customers monitor incoming messages versus outgoing messages, active tickets and new tickets.
These figures can tell you a number of things:
- The workload your team can expect
- Whether you need more or less employees on your support team
- If your ticket volume is decreasing over time as you sort out issues
Never focus on this metric alone, as judging the volume of tickets might not give you an accurate reflection of the amount of conversations you are having with customers. Some may be faulty, while others may have been redirected to another team in the first place.
Response Time
Arguably one of the more important metrics for customer support teams to analyze is the average time it takes to respond to customers.
According to a recent study conducted by SuperOffice, the average response time is between 15 and 17 hours—and thanks to our increasingly mobile-first world, that time is getting more competitive year on year.
Oftentimes a support ticket will be the first time a customer communicates with a member of staff—and yet, out of 500 companies surveyed by SuperOffice, 41 percent did not respond to customer service emails at all. Furthermore, these companies failed to send automated responses once the ticket was received.
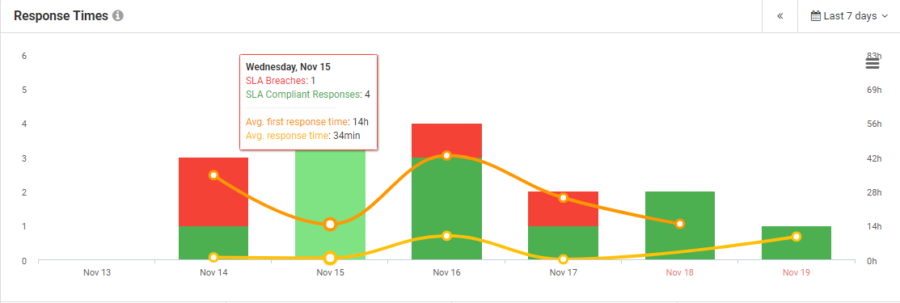
With the graph below, you can see how it’s possible to track your Service Level Agreement (SLA) metrics.
You can analyze the number of times a day that a member of your support team did not respond within the recommended amount of time. It will help you to be more efficient when delegating work to employees and indicate how long, on average, it took your business to respond to customers that day. This will give you an accurate reflection of whether your current employees are inundated with work and whether you need to consider upsizing.
Types of tickets
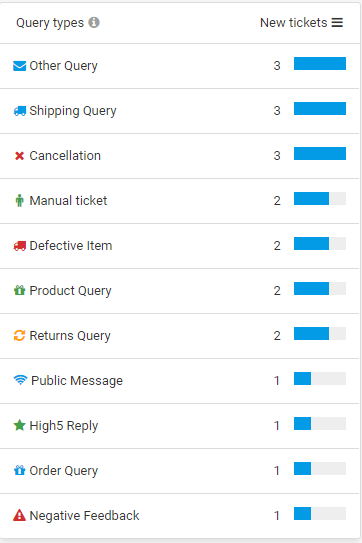
Customer support isn’t all about the numbers—it’s about contributing to the overall customer experience. Looking at the different types of customer queries that come in should give a company more context about areas that need to be improved.
Typical questions that should be looked at:
- What is the most common ticket received by your customer support team?
- Is there a completely new issue that you’ve never seen before?
- Over time, are certain issues being resolved?
You should analyze the volume of each ticket type at any given period of time to establish short- or long-term issues your customers are experiencing. These factors make your customer support team aware of the actions they should be taking and what needs to be improved.
For example, you might see that on any given day your team is inundated with order queries relating to a lack of order confirmation emails. On a long-term scale, you might find that product queries increase by 20 percent at the end of year, which suggests you may need more product information your site, or maybe some of your product pages are not working.
Customer happiness
There has never been a truer statement when it comes to customer feedback. Yes, all sellers love to share positive company or product feedback as a way to showcase the company’s worth. However, every business should look at constructive criticism as free advice on where to improve.
Plus, recent statistics show that over the last year there has been a growing emphasis on positive reviews as a way of trusting a business. Consumers read an average of seven reviews before trusting a business and positive reviews make 73 percent of consumers trust a local business more.
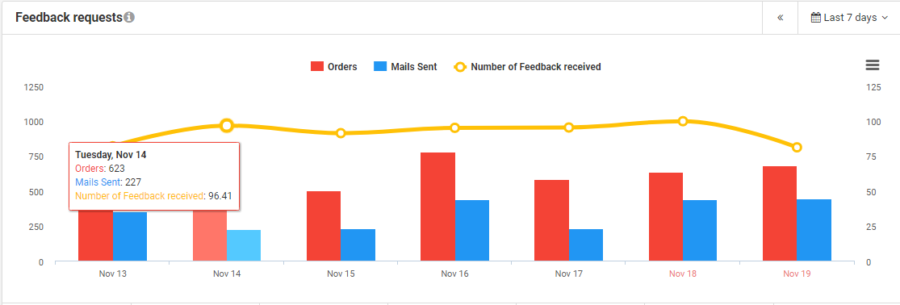
At xSellco, we encourage businesses to request feedback from the right customers at the right time. You can see the number of orders, number of emails sent and what feedback was received on any given day right in our dashboard. Putting an emphasis on gathering positive feedback will ensure customer loyalty for your business. If you want to go the extra mile with customer happiness, you should be aiming to generate 5-star reviews.
If this metric is low on your priority list, it might be time to reconsider. Forty-five percent of consumers say a lack of interest in customer satisfaction is the biggest obstacle preventing businesses from providing the ideal experience. Choose statistics that are meaningful to your business and make sure they allow you to ask questions about your overall goal.
As an e-commerce customer support solution, these are metrics we live and breathe by every day. Take a moment to put yourself in the shoes of the consumer. Ask yourself what makes an exceptional customer experience for you? Use this as a foundation for how you would like your customers to experience your online store.
Focus on improving the first three metrics—ticket volume, response time and ticket type—and you will find that customer happiness will fall into place.


