Over the last couple of years, Big Data has been unavoidable. It’s not just big, it’s massive. If you throw a stone down the streets of London or New York, you’ve got as much a chance of hitting a big data guru as you do a social media guru.
Undoubtedly, there is great power in data, but is Big Data all it’s cracked up to be?
50% of my brain thinks Big Data is great, and 50% of me thinks it’s a neologism. I’ve found it difficult to reconcile all of the varying information out there about it. So join me for the first part of a two-part series looking at Big Data. In part one, I’ll look at Three reasons why Big Data is a big load of baloney. And in part two, I’ll look at Three reasons why Big Data is awesome.
1. Big trends are trendy
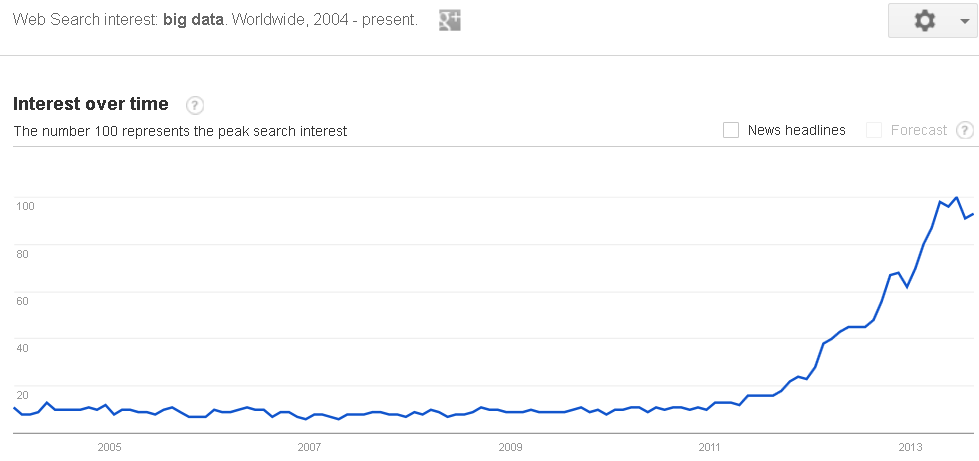
My pet rock still hasn’t moved, and my Tickle-Me-Elmo still won’t shut up. And also, Big Data is big, at least according to Google Trends:
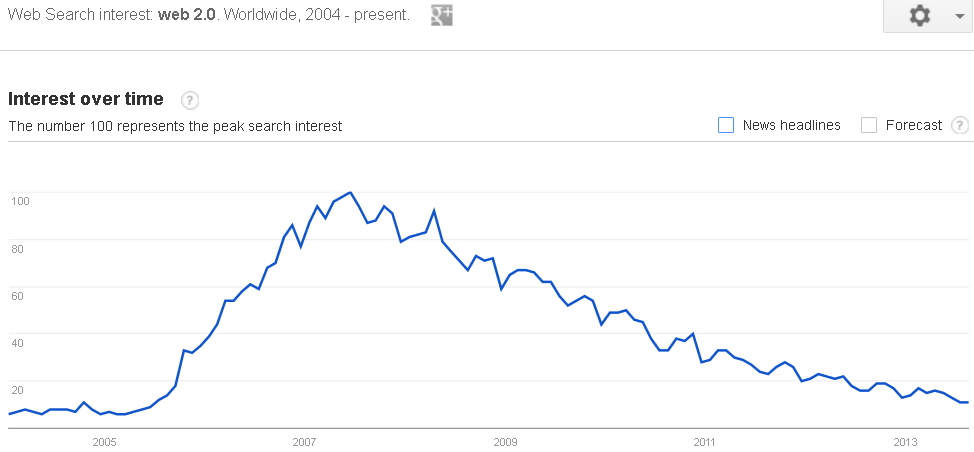
Some other terms once synonymous with the inter-web were pretty trendy too. Remember this one?
The adoption curve of the term “web 2.0” looks quite similar to where we are now with Big Data. And yet, if you still use the term “web 2.0” in your job, then you probably think the Fresh Prince still lives in West Philadelphia. (He doesn’t.)
The thing about Big Data is that it really isn’t anything new. Cluster analyses, propensity modelling, neural networks and the like have been in use in the marketing sphere for quite some time.
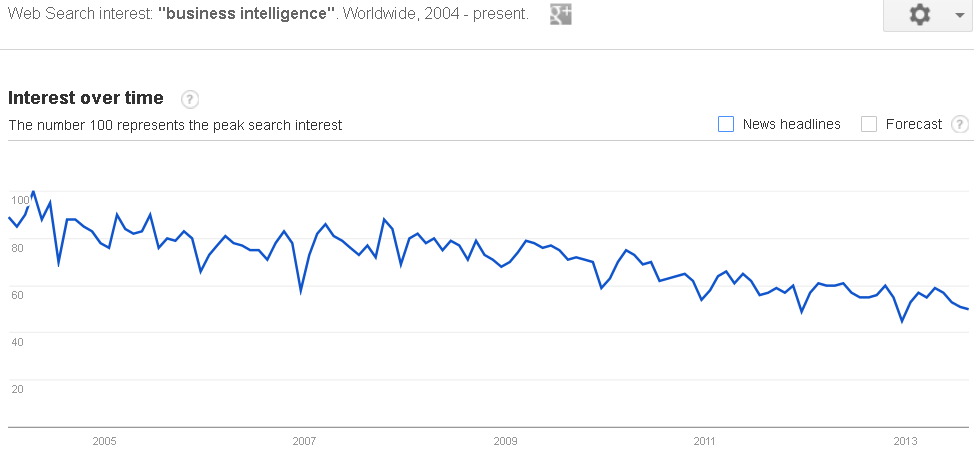
The phrase used a few years ago for this sort of stuff was ‘business intelligence’
But now, we don’t care about business intelligence anymore. Who needs intelligence? It’s over-rated. Like Goethe said, “All intelligent thoughts have already been thought”.
And yet, Big Data is everywhere. Why shouldn’t it be? It’s BIG. However, you ask 10 people what Big Data means, you’ll get 10 answers, none of which make much sense.
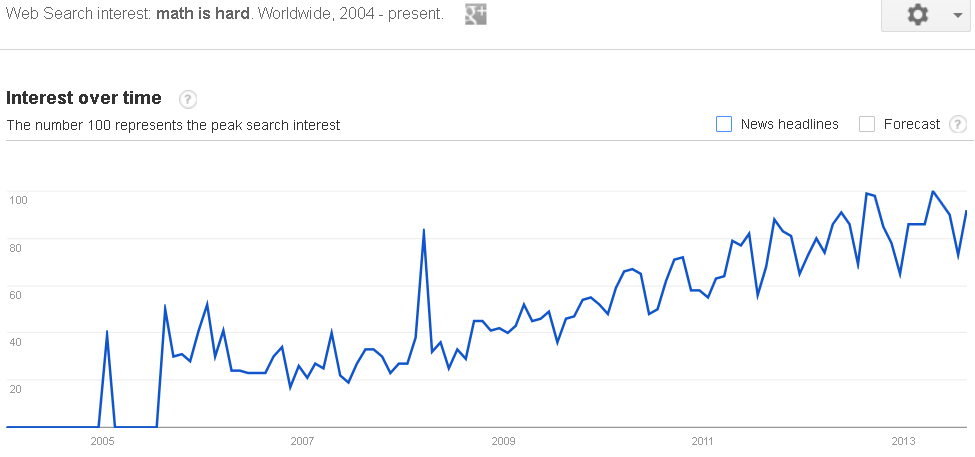
Maybe it’s because of this:
We’ve all seen Moneyball and read Nate Silver’s blog. There are people out there who are better at statistics than you. And this is scary. So what’s the solution? Throw a bunch of money at Big Data, whatever it is, and sleep soundly knowing that you’ve gainfully employed a math graduate.
And therefore, Big Data is a big load of baloney.
2. Missing one V
Gartner defines Big Data as requiring Three V’s: Volume, Velocity, and Variety. So let’s look at this a bit deeper.
Volume of data: for sure, there’s loads of data out there. Huge amounts. Check.
Velocity of data: yep, data is moved around in large quantities faster than ever before. Check.
Variety of data: in most digital marketing ecosystems, there are the following types of data (yes, I know there are more, but for the sake of argument bear with me):
-
Site stats.
-
Email engagement stats.
-
Mobile/SMS stats.
-
Past purchases.
-
Demographics, preferences etc.
And within each of these, the options are finite. For example, in email, most people measure (at the very least) opens, clicks and conversions. That’s three types of data. And for all of the other areas above it’s the same. For the sake of argument, let’s say that we’ve got 30 types of data in total. This is the thing. 30 types of structured data. Processing this data doesn’t require a super-computer, it simply requires robust statistical methodology.
So, if you’re a digital marketer, what you actually have is ‘a few sets of structured, small data’, not ‘Big Data’.
And therefore, Big Data is a big load of baloney.
3. You can perfectly predict the past
With the beginning of the National Hockey League’s 2013-14 season fast approaching, I’ve been spending a lot of time lately trying to determine the best bets to place on the eventual winner. And of course, it seems Big Data is the best route to my next million dollars. (Btw if anyone is interested in joining my hockey pool then drop me a line – go-live is 1st October!)
I downloaded as many team statistics as I could from last season and embedded them into a spreadsheet. It included rudimentary statistics such as Goals For and Goals Against, right through to Winning % when trailing after two periods, CORSI 5v5, and defensive zone exit rate. Then I ran a multiple regression and removed non-causal variables. I perfected the model such that the formula spat out expected point totals that were on average within 0.5 points of the actual result.
When I plugged in the raw data from the previous season, the outputted expected results weren’t even close to the actual results. This is a perfect case of what is called ‘over-fitting’.
When you have a lot of data, the urge is to use all of it and create an uber-complex, bullet-proof formula. Take all of your data points and find the trendline that touches everything. But there’s an inherent problem with this – all you’ve done is create a formula to perfectly predict the past.
The risks that come with an over-fitted model are twofold:
1. You are assuming that the future will be the same as the past.
2. Adding or removing variables becomes extremely difficult and risky.
So despite there being lots of data out there, the dominant strategy is to focus on the causal variables. In the hockey allegory above, while I won’t reveal my secrets, two of the stronger predictors of eventual success are goal differential and shot differential.
Not rocket science, I know – if you take more shots than your opponents you’ll generally score more goals than your opponents. However, I did learn to remove strictly correlative variables (such as Faceoff Win %, PDO and punches thrown).
Instead of focusing on Big Data and its gillions of variables, I’m instead focusing on a small amount of variables that actually matter.
Within your organisation, what are your causal variables? By looking at all the Big Data available to you, you run the risk of the truly valuable signals being obfuscated by irrelevant correlates.
And therefore, Big Data is a big load of baloney.
Disagree?
I do too. Well, 50% of me does. Feel free to elaborate on your point of view in the comments section below.
Read the second part of this series: Three reasons why Big Data is awesome here!


