For this article to be valuable let’s start with two assumptions about your data: First, that you have quality data, and second that you are capable – or have access to capabilities – to effectively analyze your data. If these two assumptions are off track, establish an initiative to address these as soon as possible. Why? Regardless of what your function, inside or outside of Marketing, quality data, that is complete, consistent, accurate, valid, and up to date, is pivotal for making high-confidence critical customer, product, and market decisions. Data without analytics is essentially raw stones waiting to be transformed from their rough crystallographic form into the shapes, outlines, and degrees of polish we value and appreciate.

There is a human tendency to seek patterns in random information. In fact, there is a name for this – apophenia. Michael Shermer has written extensively about patternicity. He believes that our brains create meaning from patterns we see, or at least think we see, in order to help us survive. His work explores the importance of pattern recognition in learning. A key point from his work is that unfortunately “we did not evolve a Baloney Detection Network in the brain to distinguish between true and false patterns. We have no error-detection governor to modulate the pattern-recognition engine.”
We employ analytics to surface patterns in our data. And this creates a challenge: It’s entirely possible for patterns to emerge that can take us in the wrong direction. Why? Because in a world where data continues to increase, so does the noise, making isolating signals – relevant patterns – more difficult. The key is to have the skills necessary to discern the signals from the noise in order to determine whether these patterns are of value. This way you can focus only on the signals important for your business, the ones that will keep you moving in the right direction.
How to Know When a Pattern is a Signal

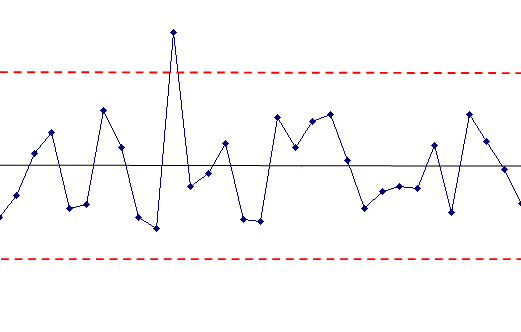
Statistical process control (SPC) is one method that will improve your ability to detect important signals. SPC helps discern signals within variation over time thereby enabling you to separate routine from exceptional variation. SPC is not new, it has been used for measuring and controlling quality for manufacturing processes. The idea behind SPC is that data that falls within control limits indicates that everything is operating as expected. Variations within the control limits are considered an expected part of the process. Data that falls outside of the control limits signal that something within the process needs to be addressed.
Being able to use this approach starts with deciding what data to collect. Ideally you want to use variable data, which takes the form of characteristics, number, or quantity that can be measured or counted. Examples of variable data include customer data, such as number of products purchased and frequency of purchase, market data, such as number of companies or rate of growth in a potential segment, and experience data, such as number of complaints or returned products. This type of data generally provides a higher quality of information.
You’ll need a measurement system that enables you to produce the same results over time and every time when measuring the same sample. Once you have collected your data, create subgroups so you can capture variations and establish your control limits. You will use your control limits to identify patterns that suggest a process or condition is out of control.
A pattern that is out of control indicates the presence of non-random variation that has a definite and specific cause, these are known as assignable causes. Patterns due to assignable causes indicate an issue that should be removed and are therefore worthy of action.
The goal of your action should be to return in-control condition. (If you don’t have the ability to establish control limits, start with industry benchmarks.) This approach helps you determine when a pattern is relevant and in what direction change needs to occur.
While this approach has its roots in manufacturing products and quality, we can apply it to any process, especially processes that impact customer experience, minimize churn, and improve satisfaction, to help determine if a pattern signals a need for action. In this way we can avoid reacting to patterns that might send us off in the wrong direction.
Tips to Make Sure You’re Heading in the Right Direction

How do you know whether the action derived from a pattern will take you in the right direction? Start with making sure the course you choose meets these five criteria, it:
1. Is aligned with your overall strategy.
2. Helps you focus on areas that enable you to create value for your customers and/or improve/optimize business performance.
3. Enriches what you know about your customers and market.
4. Uncovers opportunities for innovation and/or creating a competitive advantage.
5. Helps you mitigate risk.
Scrutinizing your path with these criteria will ensure that you’re on the right track.