 The number of views on your video isn’t the only metric that matters – it simply shows how many people have watched it. When we talk about ‘audience retention,’ we mean how well you keep viewers engaged from beginning to end. YouTube Analytics, previously known as Insight, allows you to track your performance in this area.
YouTube Analytics
YouTube Analytics gives you information which you can use to improve different aspects of your videos campaigns. It offers Earnings Reports, which allow you to track your earnings, including which of your videos are having the most impact. It also offers Engagement Reports; this helps you to understand how people are interacting with your videos and what their interests are. Traffic Sources Reports tell you how viewers are finding your videos, helping you to focus your marketing strategy. This article is most interested in Audience Retention Reports.
What are Audience Retention Reports?
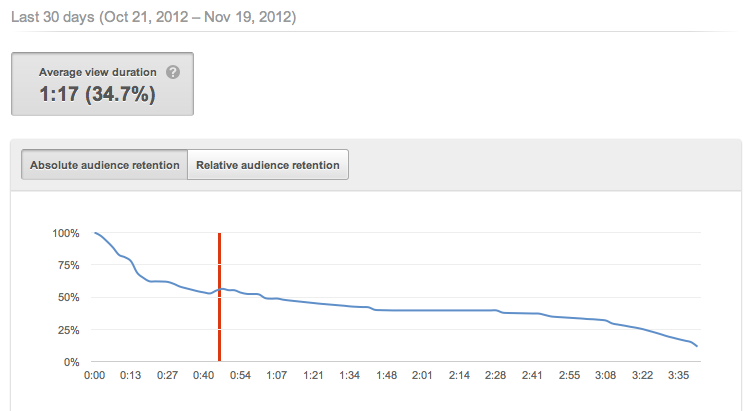
Audience Retention Reports are displayed as a graph. It is easy to make sense of the graph; it displays the views of every moment of your video as a percentage of the total views of the video. If someone shows extra interest in your video by rewinding or restarting, your graph will go up. If someone fast-forwards or abandons the video altogether, the graph will go down. This means that you can score more that 100% if a lot of people rewind or restart your video.
Here is a graph showing the performance of a particular video from MWP:
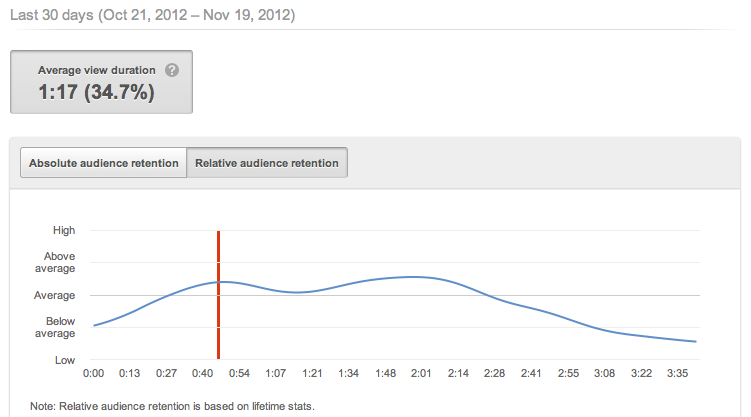
Here is a graph showing the performance of the same video relative to other videos on our channel:
See below. This is the video that these graphs relate to. The reports reveal that our viewers are interested in information about SEO for example (00:40), as the graph goes up slightly.
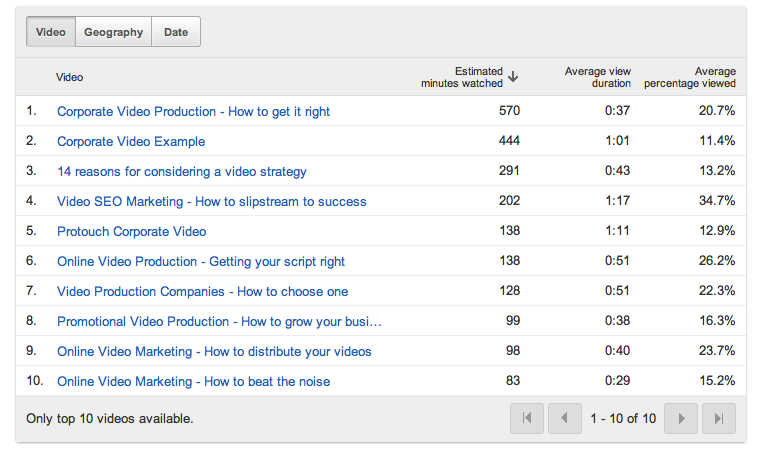
YouTube Analytics allows you to view a list of your videos with details of how much of your videos have been watched. It is useful to see your videos in terms of the ‘average percentage viewed’. See image below. You will see that the video we used as a case study above has a much higher ‘average percentage viewed’ figure than the other videos in the list – despite having been watched for less minutes. This could be because it is a shorter video, of course.
How you can use Audience Retention Reports to improve your videos
The information you can get from Audience Retention reports is extremely useful if you are the type of video creator who wants to improve your craft. Here is a list of ways that the information can be used:
a) Video introduction
Pay particular attention to the first 15 seconds of your video in the graph. This is when people are most likely to drop off and stop watching. Your mission should be to capture the attention of your audience within the first 15 seconds. If you are losing people within the first 15 seconds analyse what you have done with your introduction and how you can improve it.
b) Video length
The retention stats will reveal to you how long your videos are being watched for and if viewers are tending to ‘bounce’ away from your video before completing it. This can reveal something about the length of your video. It can also tell you which parts of your video are weakest or have less value to your audience.
c) Video hot spots
When YouTube Analytics was called Insights, they had a ‘hot spots’ feature. This is the information that you can still see in the audience retention graph. Hot spots are the most popular bits of your video – the parts where the graph peaks. By analyzing what the content is for these spots you can learn something about what your audience like to watch and what they want more of.
d) Follow up videos
All of the information you gather should be used to improve related follow up videos and even unrelated ones. You can learn a lot about the content your audience appreciates and their attention spans. Channeling this information into new videos will mean you can improve your overall performance.
How you perform in terms of retention can reveal a number of things about the content, production quality or length/duration of your video. It is important to consider all of these factors alongside each other. They are not mutually exclusive and they all influence each other.
YouTube Analytics changes regularly. To keep in the loop of changes and developments read their Creator Hub and Blog. The Creator Playbook is also a really useful tool to help you think about how to get the most out of your videos.
You may also be interested in our short video on web analytics for video.


