In the highly competitive online marketplace, marketers constantly search for effective strategies to keep their products or services on consumers’ minds.
A new ad strategy, known as view-through attribution, seems to be the latest attempt at this, with a survey showing that an increase in ad views could spell better conversions for businesses.
Japan Holds Top Spot for VTA
In a newly released ebook titled ‘A Mobile Marketer’s Playbook for View-Through Attribution,’ mobile analytics platform, Adjust highlights the rise of view-through attribution and the best practices to utilize it to stay ahead of the competition.
Get our latest playbook: Gaining visibility with view-through attribution, to learn about:
The benefits of VTA for app marketers
✅VTA adoption rates + recommended measurement windows
Insights from @TikTokBusiness, Samsung, @Snap, and @tv_scientifichttps://t.co/0g7Q24wazB pic.twitter.com/cMcZwJHVpr— Adjust (@adjustcom) June 13, 2023
buis another name for impression tracking. This tool provides marketers with the necessary framework to analyze and optimize their ad campaign performance across several social media platforms.
This would increase their ROI and finally pull more revenue into the business.
To gain deeper insights into the competitive online marketplace, Adjust analyzed apps on a global scale using VTA-powered settings.
This is to dissect the relationship between clicks, impressions, and installations over time. This analysis spanned multiple regions, providing a broader perspective on the subject.
Adjust’s report noted that Japan enjoyed the highest VTA, capturing the highest share among the top five regions at 17%, with France and Benelux sharing 14% and MENA taking 11%.
Other regions like INSEA snapped up 10% of impression tracking, and the United States came up a distant fifth at 9%.

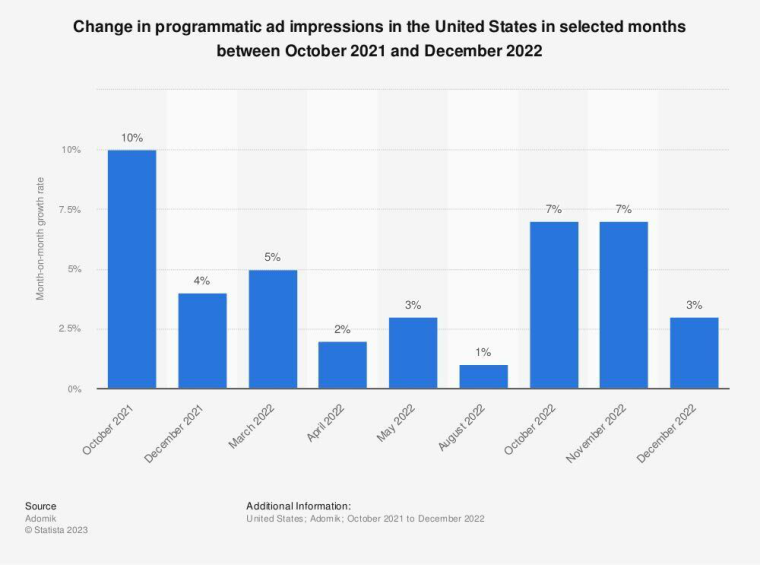
The poor VTA figure in the United States was also pointed out in a Statista chart which showed that ad impressions dropped from 10% in October 2021 to 3% in December 2022.
When examining the industries with the highest number of impression-based installations, food and drinks apps took the lead with 43%, followed by fintech apps at 36%, and gaming completed the list at 5%.
Also, differences were noticed in the number of app installations based on consumers’ preferred devices.
Apple’s iOS seems to lead the VTA pack with a 14.1% average share in app downloads from impressions, while Android secured 9.1%.
These iOS downloads mainly focused on food and drinks, e-commerce, and lifestyle apps. On the other hand, Android downloads were more focused on mobile gaming.
Not Everything Follows the Straight Path
The common idea amongst marketers and advertisers is that once ad views and impressions are high, the app installation rate should also increase. However, Adjust’s latest findings seem to debunk this idea.
According to the online mobile analytics platform, while high impressions can increase clicks and app installations, it could also cause a reduction in both criteria.
Adjust provided context by highlighting that in February 2022, there was a 16% decrease in clicks compared to the previous month, resulting in a 21% decline in overall app installations.
However, this figure mildly improved as app installations increased by 10% within the same quarter.
In May 2022, three months later, installations linked to impressions experienced a 19% increase from the February low, even though clicks were only up by 11% within the same window.
Speaking on the company’s findings, Director of Partnerships Reggie Singh pointed out the huge role VTAs play in overall campaign performance as it helps provide a more holistic view.
Singh emphasized the need to determine if an increase in clicks results in higher conversions, including identifying the specific channels where these conversions occur, despite the value of clicks in tracking app installations.
Youmna Borghol, Head of Marketing at Snap Inc., also contributed to the report, highlighting that VTAs assist app marketers in identifying lift on or from platforms such as Facebook, Instagram, TikTok, Snapchat, and Twitch.
This is achieved by focusing on purchase intent, brand awareness, and favorability.
Borghol pointed out that Snapchatters open the mobile app more than 30 times a day on average and are often influenced by friends and creators in purchasing decisions.
However, when shown ads, they don’t instantly take action and only complete purchases later.
Length of VTAs to Boost App Installs
While everyone has a different challenge in their marketing goals, Adjust believes there is a vertical-specific window that advertisers can tap into to boost their chances of business success.
However, this is based on app categories that are involved.
For instance, mobile gaming apps do better with a 24-hour VTA vertical window, while fintech requires a more elongated operational framework at 32.5 hours.
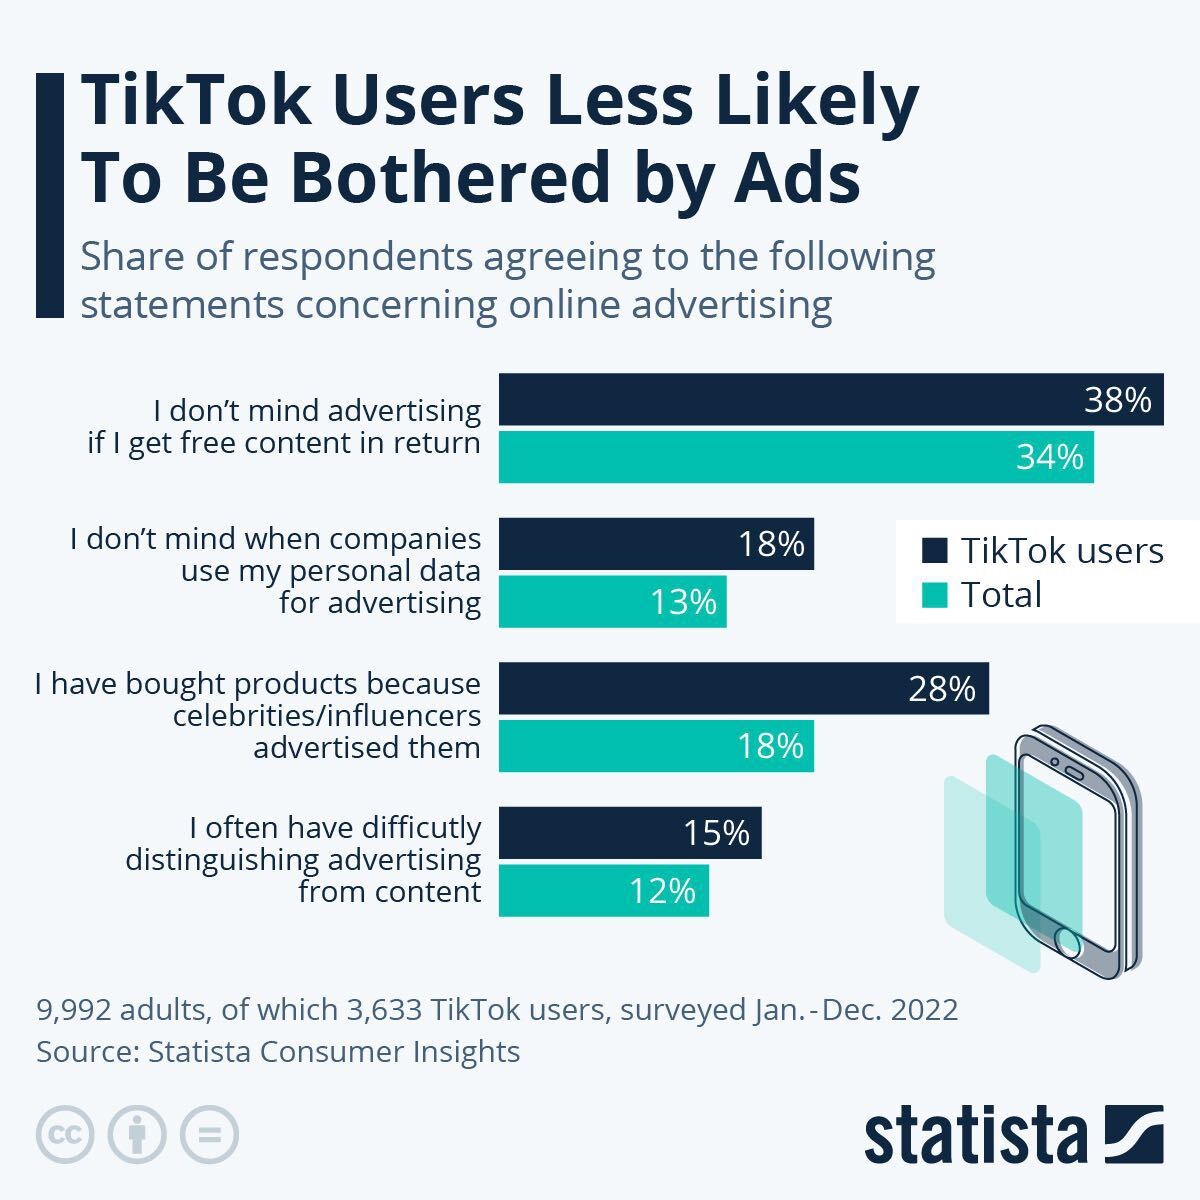
Meanwhile, in a related context, TikTok users openly expressed their indifference toward ads appearing while using the social media platform.
This research was captured following a Statista survey conducted on over 3,600 participants between January and December 2022.

According to the report, about 38% of TikTok users admitted to being unfazed by ads, but only if the advertiser throws in some freemium services.
A further 18% said they weren’t concerned if companies used their data for advertising.
Meanwhile, 15% of the users said they had difficulty distinguishing between an ad from user content on the platform.
Yep, it’s true. Longer attribution windows on TikTok ads are here.
Click-through (CTA): 1, 7, 14, 28 day
View-through (VTA): off, 1 and 7 day— Monish (@moenichedee) June 23, 2022
The social media platform launched a longer time frame for its TikTok Attribution Manager for campaigns on June 23, 2022.
The new addition brought more flexibility and customizable attribution windows, allowing advertisers and marketers to select a particular period to measure success.
Related News
- Traditional TV Advertising Spending Sees 8% Drop in 2023
-
How to Increase Instagram Followers: 15 Proven Methods to Use in 2023
- Global Ad Spending Projected to Rise 5.9% in 2023 as Digital Growth Slows
What's the Best Crypto to Buy Now?
- B2C Listed the Top Rated Cryptocurrencies for 2023
- Get Early Access to Presales & Private Sales
- KYC Verified & Audited, Public Teams
- Most Voted for Tokens on CoinSniper
- Upcoming Listings on Exchanges, NFT Drops