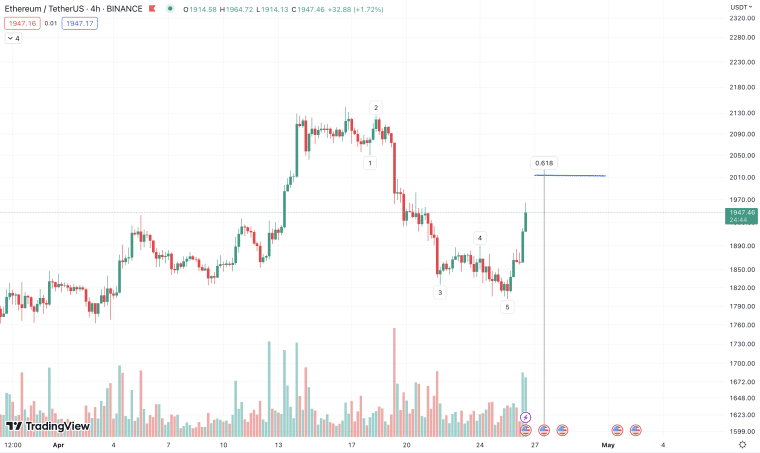
Ethereum, the second-largest cryptocurrency in the world, seems to be setting up to break through $2,000 soon. Analysts were watching what looked like a 5 wave decline pattern starting to form on the Ethereum price chart.
Tuesday morning, Ethereum started to break out as predicted, racing up 8.3% from just above $1,800 to over $1,950 in less than 24 hours. to have been confirmed by the beginning of a breakout Tuesday morning.
Most analysts who noted the pattern, like the popular technical analysis wizard “Bluntz” on Twitter, agree that the breakout isn’t finished. $2,000 is the next target, an important threshold which may provide resistance once it is cleared.
Elliott Wave Theory Explained and Applied to Ethereum
A 5 wave decline is one of many patterns encompassed by Elliott Wave Theory. Ralph Nelson Elliott noticed that stock markets (and other markets) traded in repetitive patterns in the 1930s.
Most investors and analysts at the time thought that price fluctuations were almost entirely random. Where others saw chaos, Elliott saw fractal patterns.
Over the years he developed a long list of patterns that he saw repeating themselves throughout a large variety of stocks and indexes. Elliott hypothesized that there are 2 main types of these patterns: impulse waves and corrective waves.
Impulse waves consist of a 5 wave pattern, fluctuating up and down but following the larger scale trend. Corrective waves follow impulse waves directly and travel in the opposite direction.
This is what analysts saw forming on Ethereum. An impulse wave formed moving down and reversed, indicating a coming corrective wave traveling up.
Medium and Long-Term Ethereum Price Prediction
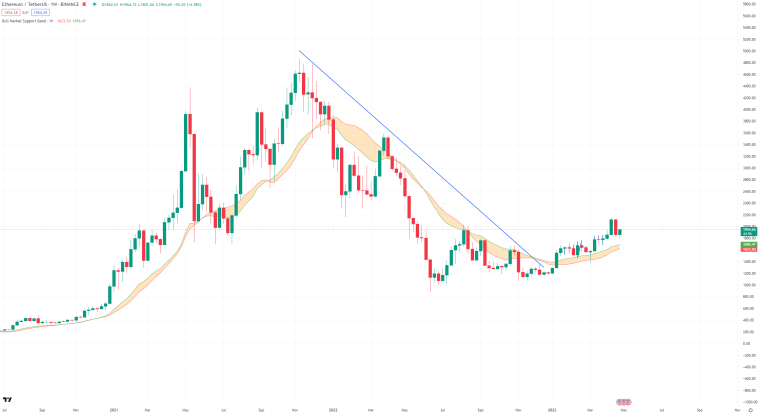
Ethereum also looks extremely bullish in the long term as well. It just broke through one of the most popular indicators with traders, the Bull Market Support Band (or Bear Market Resistance Band).
The Bull Market Support Band is simply 2 moving averages combined: the 20 week simple moving average (SMA) and 21 week exponential moving average (EMA). When a crypto is trading above the band, it is a bullish indicator, suggesting that it will stay above the band.
When it falls below the band, this can indicate the beginning of a bear market. Its price will tend to stay below the band. Like all indicators, the band isn’t perfect but it is still one of the most predictive. Ethereum has faked-out investors by breaking through the band and then falling below it days later.
Ethereum vs Bitcoin Price Predicition
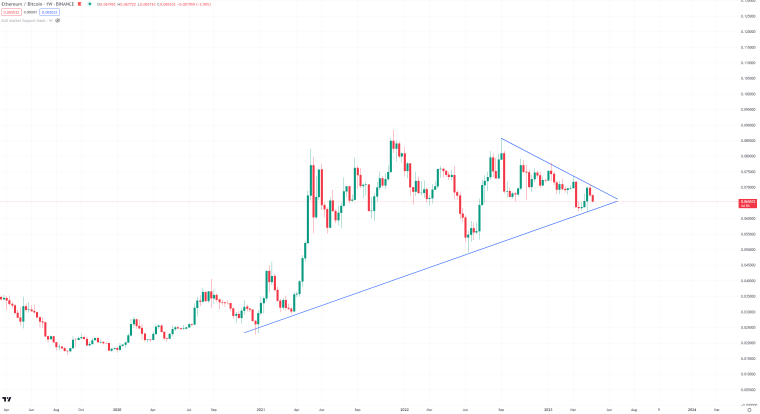
While Ethereum’s dollar valuation is the most popular, it’s also important to watch how it performs against Bitcoin. Even though Ethereum usually goes up when Bitcoin does and vice versa, the scale of their moves don’t always align. This is clear in the ETH/BTC chart.
While the ETH/USD pair is looking quite bullish, ETH/BTC seems to show a slightly different story. Over the past few months, Ethereum has continued to reach new local highs against Bitcoin, invigorating investors.
However, these local highs are all slightly lower than the previous high, indicating a bearish overall move against Bitcoin. This could mean that Bitcoin is a better choice in the medium term until ETH/BTC escapes from its downward trend.
Decided to Buy Some Ethereum or Bitcoin? You Can Buy Both Here.
Related Articles:
- Nvidia Says its New Software Can Fix ChatGPT’s Biggest Weakness – Making Things Up
- YouTube Revenue is Down This Quarter Yet Again – How Can Google Turn it Around?
Love Hate Inu - Next Big Meme Coin
- First Web3 Vote to Earn Platform
- Latest Meme Coin to List on OKX
- Staking Rewards
- Vote on Current Topics and Earn $LHINU Tokens

