The cryptocurrency market continues to ooze pessimism with many analysts believing that Bitcoin (BTC) has one more leg to go downward. If the market conditions persist, FindStrat analyst says it could bottom out in July, while a CNBC analyst says it could crash to $10,000. If this happens, the summer of 2022 will be the highlight of another crypto winter.
Cryptoassets are a highly volatile unregulated investment product.
Bitcoin (BTC) To Bottom Out In July
BTC could bottom out in July according to Mark Newton, Head of Technical Strategy at Fundstrat. In a note made on the company’s FSInsight website on June 29, technical analysis reveals that Bitcoin could see a trend reversal in July based on weekly and monthly charts.
Why Bitcoin likely bottoms out in July
Get the full report from @MarkNewtonCMT, only at #FSInsight!https://t.co/rcWX9BnGFf pic.twitter.com/PdyZrIpvpX
— FS Insight (@fs_insight) June 30, 2022
Usually, when multiple timelines line up, they typically provide a long-term trend reversal, and that the crypto market was at the end of seeing all the pieces falling into place, Newton said on Thursday.
If you are getting to buy Bitcoin when this happens, it would be important to note that BTC’s weekly and monthly charts have not yet aligned. Although, “this very well might come to fruition for the first time since last November’s peak in 2021, as of next month, July 2022,” Newton explained.
Considering that Bitcoin crypto “has had good success over the last dozen years at making cyclical lows every 90 weeks,” Newton noted that BTC’s cycles start to turn up between July and November. As a result, the technical analyst is projecting “Summer bottom which likely happens in July and turns up into November of this year, with minor dips into Spring 2023 providing buying opportunities for further strength into late 2023,” the note said.
“Given that Equities still look to possibly fall into mid-July, it’s likely that BTCUSD also could follow suit and challenge and undercut June lows at 17,592.78 by a minor amount. (As such) $12.5K-13K “would be my preferred area to buy dips” if the June lows get taken out.
There were three key takeaways from Newton’s note were (as quoted):
- SPX trend turned back to negative on June 28; Challenge of lows likely post July 4.
- Bitcoin DeMark exhaustion could pinpoint a major low in July.
- Cycle analysis also shows Bitcoin to be bottoming out and turning back up in July.
The flagship cryptocurrency is witnessing its most intense wash out since the 2018 bear market amidst shrinking liquidity, tighter financial conditions, increasing inflation and recession risks.
As BTC trades below $20,000, the big crypto may see more downside if headwinds from this technical barrier push the price lower. This is because, it would the the first time since December 2020 that Bitcoin is sealed below this level and could suggest that an extended downleg was in the offing.
Just where could Bitcoin (BTC) bottom out?
‘Bitcoin To Crash To $10,000,’ CNBC Analyst
Bitcoin still possesses more downside potential even as it trades more than 72% below its November 10 peak, according to Brian Kelly, a CNBC analyst.
Kelly said this on CNBC’s Fast Money segment arguing that the bellwether crypto could still fall 50% from the current levels in the wake of a worsening macro environment. Kelly painted a scenarion which was both positive and negative. “The good news is that I do think we are getting a lot closer to a generational bottom. The bad news is that it might not be until Bitcoin hits $10,000.”
Bitcoin (BTC) was trading at $19,134 at the time of writing this article.
According to the CNBC analyst, Bitcoin will hit the bottom after it experiences a Lehman moment. This scenario is when the fear that turmoil in BTC or the crypto industry could spread to other sectors of the world economy. However, Kelly notes that we could still be months away from that kind of last flush rash. It could be occasioned by one big crypto player or firm going bankrupt that no one expected.
According to Kelly, the Bitcoin crash could be triggered by central banks’ policy errors and accentuated by deleveraging in the market.
“The catalyst for it is going to be inflation expectations picking up and every central bank in the world is making a policy error… And I think if you get those three combos, a final flush out of all this leverage in Bitcoin down to $10,000, $15,000, somewhere around that, and inflation expectations picking up, which I see coming in the next quarter or so, and we all know every central bank has already made a policy mistake and likely to continue to do more, that is the perfect scenario for a bottom in Bitcoin.”
Over the past 24 hours, Bitcoin (BTC) is down 2% to $19,134 and 35% down over the last 30 days.
A Bearish Triangle Poses Threat To BTC Price Recovery
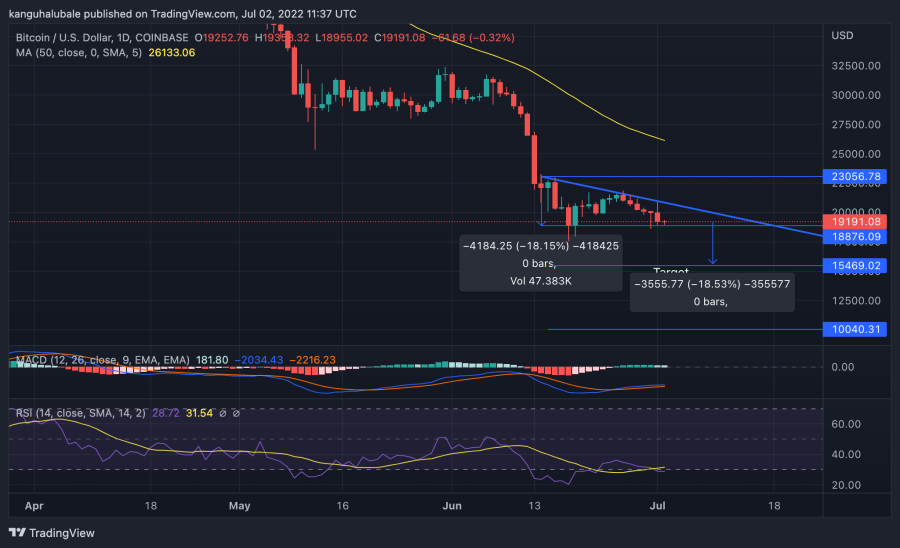
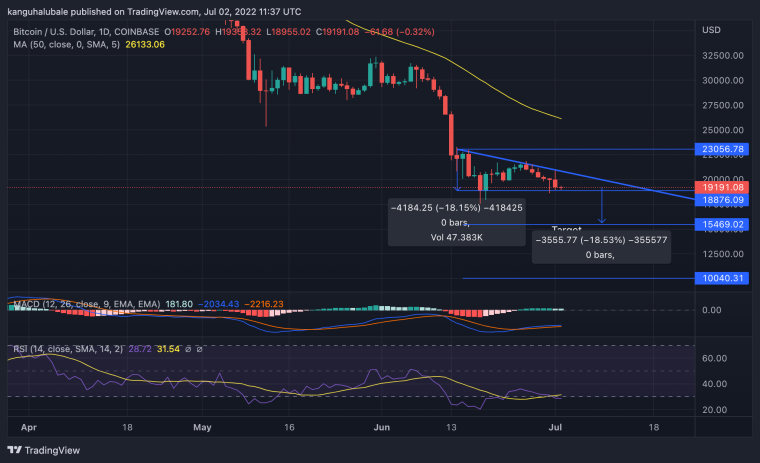
After shedding more than 75% of its value to set a swing low at $17,567 on June 18, BTC sharply recovered to areas above $21,000 on June 26. Since then, the pioneer cryptocurrency has produced a series of lower highs and relatively equal lows around $18,876. This has led to the appearance of a descending triangle on the daily chart (below).
This technical chart pattern projects a 18% move in either direction from the breakout points, however, the consolidative formation of the triangle usually favors the downside. If Bitcoin’s price breaks down below the horizontal trendline at $18,876, it would trigger a massive descent to $15,700. On the upside, a bullish breakout would be triggered by a rise above the descending trend line at $20,700, triggering a rally to $23,056.
BTC/USD Daily Chart
The bearish outlook was supported by the downward movement of the 50-day Simple Moving Average (SMA) and the downfacing Relative Strength Index (RSI). The price strength at 28 suggested that the sellers were in full control of Bitcoin and that there was still more room for the downside.
In addition, the Moving Average Convergence Divergence (MACD) indicator was in the negative region below the neutral line. This pointed to a market that is still controlled by negative sentiments.
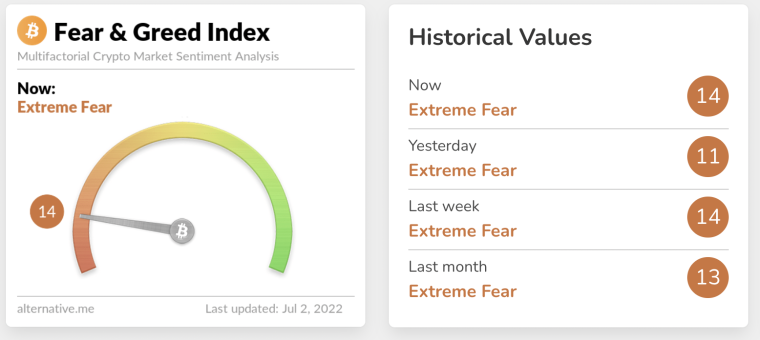
The crypto fear and greed index is up 3 points in the last 24 hours to 14, but still in the ‘Extreme Fear’ zone. An area it has been stuck in for the last one month, a sign that investors are too worried and may sell their holdings to minimize losses.
However, Alternative notes that “Extreme Fear” scenarios offer an opportunity for late investors to invest in cryptocurrency. According to Arcane Research, buying when the Crypto and Fear Index reaches a score of 8 or below results in average median one-month returns of 28.72%.

Even though the recent sell-off appeared to paint doom for the favourite crypto, the daily chart revealed that the BTC bulls usually gather within the $10,000 and $15,000 range. As such, a drop to these levels could provide a launching pad and would bolster Bitcoin’s price to the descending triangle’s resistance line at $20,700.
As such, a daily candlestick close above the said level would confirm a bullish breakout, paving the way for BTC to the technical target of $23,056. This would bring the total gains to 21%.
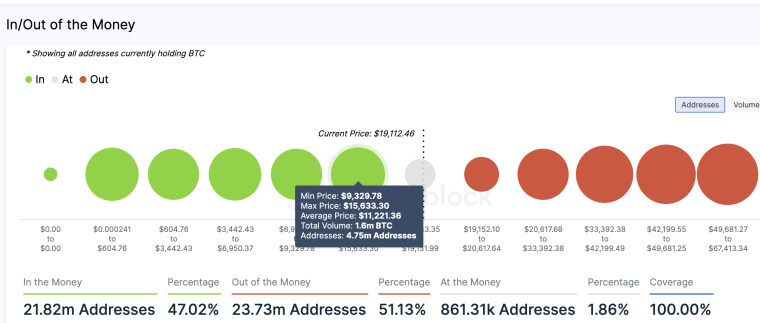
The possibility of Bitcoin bottoming out within the $10,000 to $15,000 range was affirmed by on-chain data from IntoTheBlock, a crypto data analyst firm. Its In/Out of the Money Around Price (IOMAP) model revealed the digital sits on relatively robust support within this price range.
According to the IOMAP chart (below) this represents a buyer congestion area around which roughly 4.75 million addresses previously bought approximately 1.6 million BTC.
Bitcoin IOMAP Chart

Therefore, any efforts to push Bitcoin below this zone would be met by buying pressure from this cohort of investors who may be looking to get their heads out of the waters.
The technical analysis, technical indicators and on-chain metrics corroborates Brian Kelly’s and FundStrats’ analyses that Bitcoin could bottom out at these levels.
Related:
eToro - Top Crypto Platform
- Free Copy Trading of Professional Traders
- Free Demo Account, Crypto Wallet
- Open to US & Worldwide - Accepts Paypal
- Staking Rewards, Educational Courses
