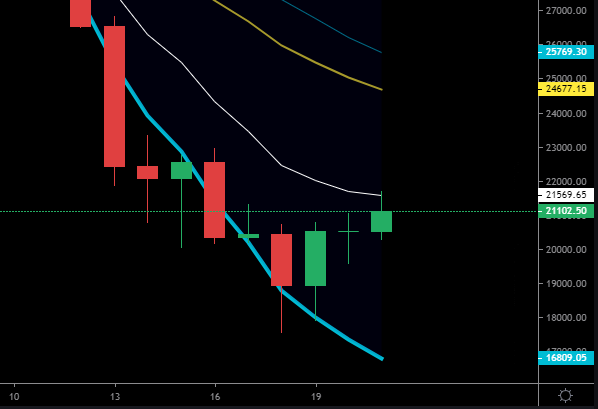
The daily close above the bottom of the bollinger band on June 18, was followed by a bullish engulfing candle pattern and a dragonfly doji.
Traders that took those as a buy signal and entered a position on June 21 at around $20,500 nailed an over $1,000 move to the daily EMA 8 at $21,570 – a 5% gain without leverage.
Cryptoassets are a highly volatile unregulated investment product. Your capital is at risk.
Best Bitcoin Indicators – How to Use
Those kind of Bitcoin indicators are used by many BTC traders – they’re also some of the most simple, compared to more complicated technical indicators like the Stoch RSI (stochastic relative strength index) or MACD (moving average convergence divergence).
Many of the best crypto traders just use a few basic Bitcoin indicators for technical analysis (TA) alongside just looking at the price action (PA) , support and resistance levels, and marking out price ranges and trend lines.
As well as being aware of any fundamental analysis (FA), i.e. major news developments that could be a catalyst for Bitcoin price swings. This week that was investors being in extreme fear over news of Celsius being close to liquidation, and other Ethereum whales.
Bitcoin indicators are often more accurate on a high timeframe (HTF) chart like the daily or weekly chart, as cryptocurrency is a very volatile asset class. Above we analyzed the daily Bitcoin price chart.
Bollinger Bands
The bottom of the Bollinger band – in light blue on the Bitcoin price chart above – was at around $18,800 on June 18th when Bitcoin was crashing.
Most traders warn against trying to catch a falling knife, and waiting for a HTF candle close to get a clearer picture of the trend – Bitcoin pierced the bottom of the Bollinger band, but bounced at $17,600 to close back above the bottom Bollinger band, at around $18,900.
That was a signal that the Bollinger bands were acting as support, as they usually do when tested from above, and could therefore provide a bounce.
Bollinger bands are typically plotted at two standard deviations above and below the price, and are a measure of when an asset is overbought or oversold and likely to retrace or bounce.
EMA 8
EMAs (exponential moving averages) are also often used as support and resistance lines by traders – so closely watched that they can become a self-fulfilling prophecy. One popular one is the EMA 8 on a daily or weekly timeframe.
When Bitcoin bounced off the Bollinger bands, the next logical price target for many traders would be the EMA 8 – which was hit today (three days later) at around $21,570.
The daily EMA 8 then acted as resistance when retested from below at the first attempt to break it – Bitcoin made it slightly above then corrected to closer to $21,000. That EMA would have been a good point to take profit on some of the position.
Bullish Engulfing Candle
Before the daily EMA 8 was hit, further confirmation that a local bottom was in and continuation to the upside likely, was the bullish engulfing candle pattern on the 19th.
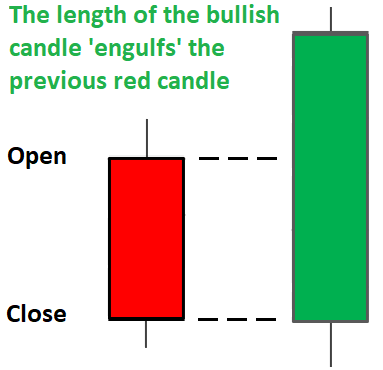
That means the green daily candle on the 19th engulfed the entire body of the previous red candle, closing above the daily open on the 18th.
A simple Bitcoin indicator – bullish candlestick patterns
Bullish engulfing candles are useful on any timeframe for prediction price movements – they signify bulls have taken control over bears, or vice versa for a red bearish engulfing candle.
Dragonfly Doji
A Doji candle forms when openning and closing prices are very close together, as they were on the 20th. Leaving a thin candle body and just wicks above and / or below.
A Long-Legged Doji forms when the wicks to the upside and downside are around the same length – so the candlestick looks like a plus sign – reflecting indecision about the trend direction and equal strength from bulls and bears.
A Gravestone Doji forms when the opening and closing prices are near the bottom of the candle, i.e. there’s more of a wick to the upside and bears were stronger.
On the 20th, a Dragonfly Doji appeared, showing the opening and closing prices close to the top of the candle and a longer wick above. This is seen as a bullish signal to buy Bitcoin since buyers were stronger, suggesting that the next candle will likely continue moving up—setting up a trade opportunity.
That’s what happened on the 21st, as the next daily candle moved from $20,500 to $21,500 so far – with several hours left in the day at the time of writing.
The next Bitcoin price targets for some traders will be – the daily EMA 21 at $24,670, the middle of the Bollinger bands at $25,770, and the top of the Bollinger bands (off screen) currently at $34,700. Although those Bitcoin indicators will change in position each day.
Trading News
eToro CopyTrader™ Tool
- Buy Crypto & Copy Trade Professionals
- Copy a DeFi or Metaverse Portfolio
- Free to Use, Automated Trading
- Mimic From 1 - 100 Traders
