Google Trends is a free tool that provides search data for keywords and topics. A lot of marketers underestimate the value of this tool is because it doesn’t offer the same metrics as other keywords tools, such as impressions and CTR estimates.
Then again, Google Trends isn’t really a keyword tool. It’s more like an interest research tool and it allows you to segment data in a number of powerful ways.
If you’re not sure what Google Trends is, take a look at or articles What is Google Trends? and 8 Google Trends tips for advanced SEO insights, where we explain some of the advanced insights you can get from it.
For today, we’re looking at practical examples of how to use Google Trends to improve your search marketing strategy.
#1: Use Google Trends for strategic planning
You can take insights from Google Trends to create SEO and content strategies that address your audiences’ needs as they change throughout the year. This process involves monitoring the search volumes of key hero terms over different timeframes (days, weeks, months etc) and comparing them to interest levels from previous years to spot patterns and emerging trends.
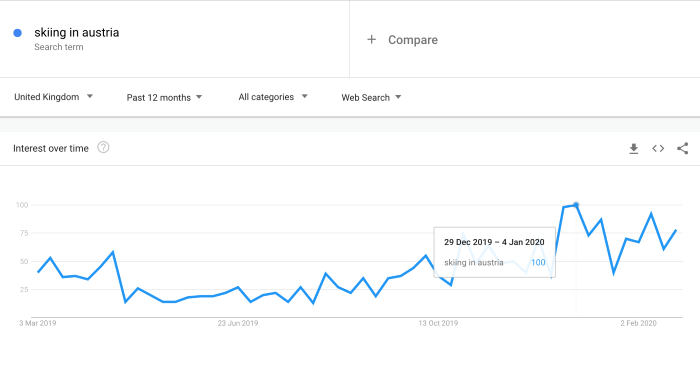
Let’s imagine a ski resort in Austria wants to target UK holidaymakers as one of its key audiences. Like many businesses, interest is highly seasonal, dependent on the weather and affected by calendar events such as school holidays.
So the first thing this company might do is check how the search volumes for key hero terms vary across the year.
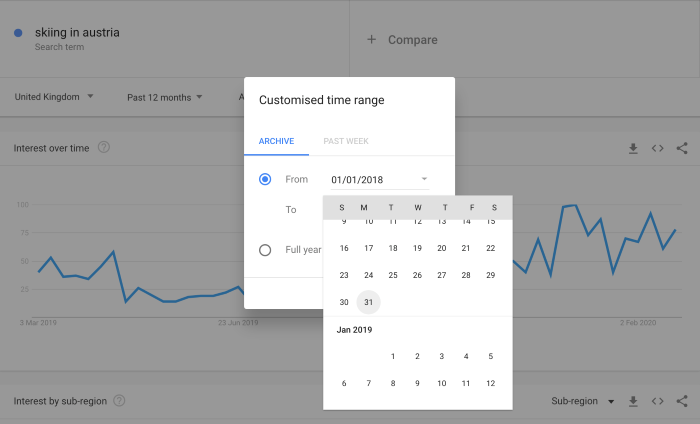
Now, by default, Google Trends returns data for the past 12 months. However, you can easily change this by defining a custom time range, which allows you to compare search volumes for every year going back to 2004.
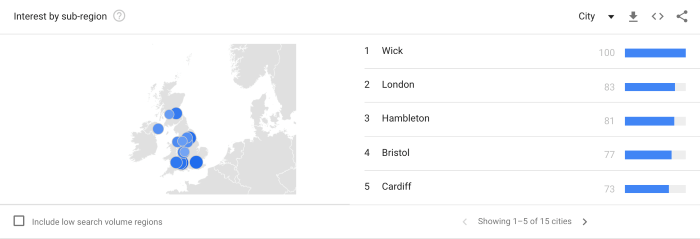
You can also cross-reference this data by location to see which parts of the country are most interested in your hero terms.
Already, you can see that we’re getting valuable information from Google Trends. But how does this translate into better marketing and business decisions?
Use seasonal data to generate leads throughout the year
Over the past 12 months, search volumes for “skiing in Austria” declined in April and recovered in October, with a peak in late December/early January. As we would expect, interest is highest during the winter months but there are still spikes in interest to work with throughout the year.
People don’t normally wake up one day and decide to book a skiing trip for next week. They plan trips like this over a period of weeks, months or even longer. So the first thing you can do is use this data to predict when bids should be highest on your PPC ads. It’s also important to rank strongly in organic search during these periods because most of your leads are likely to come from people planning for the next winter season.
Target high-intent searches during shoulder seasons
Shoulder seasons are the period between peak and off-season where things generally die down. Lead quantity naturally declines but there are a number of steps you can take to maximise profit during these periods:
- Adapt your messages: For example, ski resorts will promote off-season activities.
- Incentivise: Run promotions encouraging people to book now.
- Targeting: Target high-intent leads that are more likely to convert and require less investment to close.
- Customer retention: Reach out to existing/former customers and tempt them into making the next purchase.
- Referrals: Run referral campaigns with existing customers, encouraging them to recommend your business to their friends, family members, colleagues etc.
- Differentiate: Use seasonal trends data to differentiate your brand and mitigate the negative impact, e.g. all-year-round skiing.
Google Trends will even tell you how to adapt your messages, what kind of incentives work, which high-intent search terms to target and how to discover which interests you can satisfy through differentiation.
#2: Use Google Trends for technical SEO
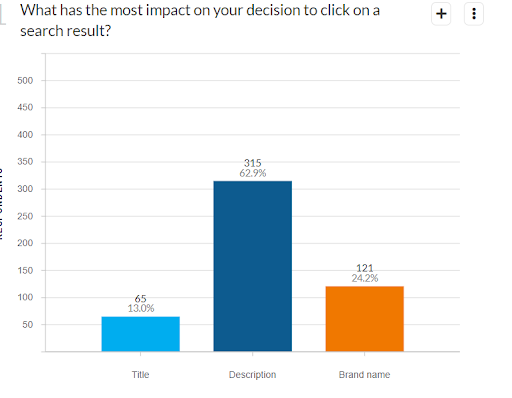
Now let’s take a look at how to use Google Trends to help with the technical side of things, such as optimising your page titles, meta descriptions and page content to match user interests. A recent study conducted by Ignite Visibility found that meta descriptions have the most influence on which result users click – by a long margin, too.
Relevance is everything here. Users read these previews to decide whether pages will provide the information they’re looking for.
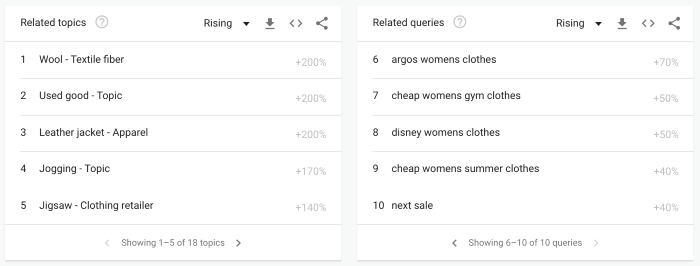
So a clothing brand can turn to Google Trends and type in something along the lines of “womens clothes” and look at the Related topics and Related queries sections to see which items are currently in-demand.
You can then use this data to optimise your meta descriptions to include the most popular items right now and reorder your page content to show the most in-demand items first. Likewise, you might want to change your use of images in the hero sections of pages to reflect current interests.
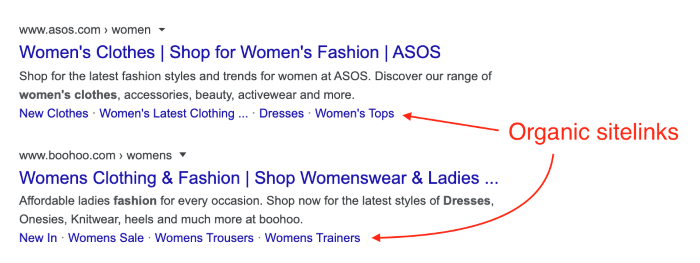
Taking this even further, there might be some search trends that prompt you to create new pages entirely. Or you could create new category pages that could rank for emerging search trends and possibly even generate site links in your organic listings.
You can get quite granular with this too. For example, you can look at search volumes for the past seven days and compare this with weekly data for the past month, quarter, year and past few years.
You can then identify the days and times of day when interest is strongest, and compare this data with related topics and search queries to gain a more rounded view of what’s inspiring people to type these keywords into Google.
Now, you’re starting to get in-depth search insights. But there comes a point where you’re limited by the data available on Google Trends and the manual workload of comparing data.
Luckily, we can fix this problem.
#3: Use the Google Trends API to extract data
By using the Google Trends API, you can extract data from the platform and play with it how you like. This is precisely what we’ve done with our Apollo Insights platform, which extracts data from Google Trends and search data from dozens of other third-party sources.
This allows us to add Google Trends data into a much larger, comprehensive dataset and compare insights. For example, we can build up a picture of how your brand is performing against industry benchmarks and competitors.
Crucially, Apollo gives us full control over this data so we can work with it quickly.
In the last section, we touched on the idea of segmenting search volumes weekly and comparing results to previous weeks across months or years. It would take a lot of time to extract this data manually from Google Trends before you even analysed, cross-referenced, visualised and then compared it with data from other platforms.
Apollo allows us to do this almost instantly.
Which means we might see random spikes in search volumes and sales for the same products throughout each month. This will prompt us to investigate and find out why this is happening. Sometimes, these spikes might be occurring at different times across the country. Other times, there might be more widespread and, occasionally, almost nationwide peaks of interest.
Time for another look at Google Trends?
Google Trends is a powerful tool in its own right but it really comes alive when you extract its data and integrate it with datasets from other sources. In today’s data-driven marketing environment, this is how you build a 360-degree view of your search marketing performance and spot new opportunities before everyone else.
