Digital marketing budgets continue to rise, often at the expense of offline advertising spend. But digital marketers must continue to evolve practices as they strive to make their content an asset, rather than an annoyance, to prospective buyers.

The most important finding from recent research is this: the average person now spends more time online than watching TV and using all other media (like newspapers and magazines) put together. As a result, digital marketing budgets are expected to grow by double-digit percentages this year, with the Internet set to become the biggest platform for advertising in 2016, surpassing TV.
Here are five more key takeaways from the digital marketing stats and facts detailed below:
Digital, social media marketing budgets will grow. Spending on digital marketing is projected to increase by 12% to 15% on average. Social media’s share of the total marketing budget will grow from 10% in 2015 to 14% this year, while spending on offline advertising will fall 2%.
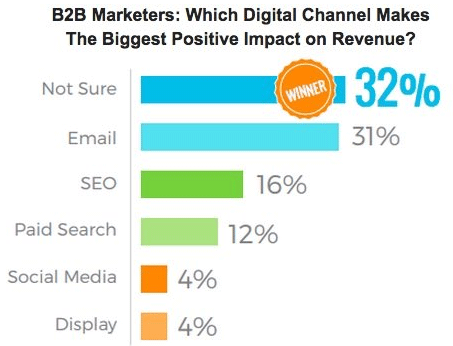
Measurement remains problematic. Most small businesses struggle to measure the results of digital investments. A third of marketers say they don’t know which digital tactic has the biggest revenue impact, and nearly one if five small businesses don’t track anything.
Consumers hate online ads. Granted, not all consumers, but a significant and growing share. Worldwide, nearly 200 million Internet users have now installed ad blocking software. Estimates regarding the share of millennials who block ads range from 34% to as high as 63%. The average click-through rate of online display ads is 0.6%, and more than half of Internet users say they won’t click on ads because they don’t trust them.
Yet marketers continue to spend heavily on online advertising. After SEM, online display advertising (banner ads and retargeting) capture the biggest share of online spending at 34%, representing roughly 10% of total marketing budgets.
Native advertising may be the answer. Native ads are viewed 53% more than banner ads. That’s perhaps why the growth in B2B digital ad spending over the past two years has been due largely to increased spending on native ads, while display has become less important.
Here then, the details.
5 General Digital Marketing Stats
1. The average person now spends more time online than with TV and all other media (newspapers, magazines, etc.) combined. (Branding Bricks)
2. Total spending on Internet advertising is predicted to grow 12.9% next year. The Internet will become the largest medium for advertising in 2016 (ahead of TV). (MediaPost)
3. Less than 8% of total B2B product sales are closed directly through the Internet, versus 15% for B2C products. (The CMO Survey)
4. Social ad spending has doubled over the past two years. (iMedia Connection)
5. By 2019 mobile advertising will represent 72% of all US digital ad spending. (Payfirma)
2 Digital Marketing Measurement Stats
6. Less than 30% of small businesses use Web site analytics, call tracking, or coupon codes. 18% of small businesses admit to not tracking anything. (MediaPost)
7. One-third of marketers say they don’t which digital marketing tactic has the biggest positive impact on revenue. 26% of respondents say email is the digital marketing channel with the greatest positive impact on revenue; SEO is second (17%), followed by paid search (15%), social media (5%), and online display advertising (5%). (MarketingProfs)
6 Stats and Facts About Digital Marketing Budgets and Spending
8. CMOs plan to increase their spending on digital marketing in general by 14.7% over the next year, and to raise social media’s share of total marketing spending from 9.9% currently to 13.5% in the next twelve months, and 22.4% five years from now. (MediaPost)
9. Spending on digital marketing is predicted to grow 12% in the next year, while budgets for traditional (non-Internet) advertising will fall 2%. (The CMO Survey)
10. B2B digital ad spending increased 15% to $5.8 billion in 2014 — due largely to growth in native advertising — while display advertising is becoming less important. (MediaPost)
11. Digital marketing spend is forecasted to account for 35% of total budgets in 2016. (Business2Community)
12. After SEM at 47% of total digital marketing spend, online display advertising (banner ads, re-marketing, and re-targeting) is expected to capture the next biggest share of the online spend at about 34% of total online spend and about 10% of the total marketing budget. (Business2Community)
13. The top four channels for increases in digital marketing spend last year were email marketing (61% of marketers increasing spending on this channel), social media (49%), mobile marketing (40%), and SEO/PPC (38%). (Relevate)
7 Digital Advertising Stats
14. 45 million U.S. Web users had deployed an ad blocker as of late 2015. In Europe, around 77 million people now block ads—a 35% increase from 2014. (MediaPost)
15. Ad blockers resulted in nearly $22 billion of lost ad revenue for publishers worldwide in 2015, with about half that total (roughly $11 billion) in the U.S.. (MediaPost)
16. The average click-through rate of display ads across all formats and placements is 0.06%. (HubSpot)
17. 54% of users don’t click banner ads because they don’t trust them. (BannerSnack)
18. Native ads are viewed 53% more than banner ads. (HubSpot)
19. Users who are retargeted to are 70% more likely to convert. (HubSpot)
20. Programmatic advertising currently represents nearly two-thirds (62%) of the digital display advertising marketplace (online, social and mobile) and will grow to 82% by 2018. The size of the programmatic marketing is expected to more than double over the next three years. (MediaPost)